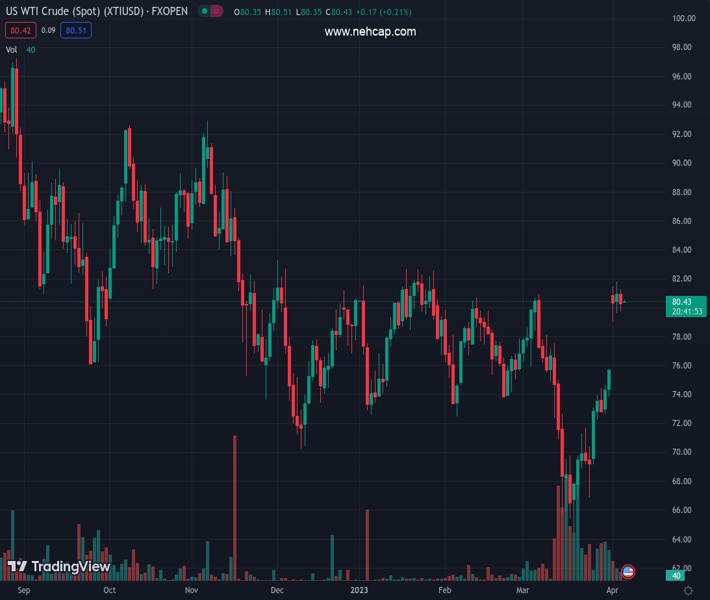
WTI portrays bullish consolidation around 10-week high, picks up bids of late. (Pivot Orderbook analysis)
…
This is a premium post.
[s2If !current_user_can(access_s2member_level4)]Please register for PREMIUM VERSION HERE to read full post below containing analysis. In case of any error or you think you are not able to read the full post below, please email us at support#nehcap.com [lwa][/s2If] [s2If current_user_can(access_s2member_level4)]
- WTI portrays bullish consolidation around 10-week high, picks up bids of late.
- US Dollar’s corrective bounce, risk-off mood and downbeat EIA stockpiles previously probed Oil buyers.
- Geopolitical woes, the greenback’s fresh downside keeps WTI bulls hopeful ahead of key US jobs report.
The pair currently trades last at 80.54.
The previous day high was 81.25 while the previous day low was 79.75. The daily 38.2% Fib levels comes at 80.32, expected to provide support. Similarly, the daily 61.8% fib level is at 80.67, expected to provide resistance.
WTI crude oil regains upside momentum, following the first daily negative in five, as the US Dollar reverses the previous day’s corrective bounce. That said, the black gold picks up bids to print mild gains around $80.55 by the press time of early Thursday morning in Asia.
That said, the US Dollar’s corrective bounce joined downbeat Oil inventory data to trigger a pullback in the commodity prices. Also challenging the WTI buyers were recession fears. However, the broad USD weakness and geopolitical tensions emanating from China and Russia keeps the buyers of the energy benchmark hopeful.
The weekly stockpile data from the US Energy Information Administration (EIA) marked -3.739M figure versus -2.329M market forecasts and -7.489M prior. Earlier in the week, the American Petroleum Institute (API) also flashed downbeat inventory data for the week ended on March 31, -4.346M versus -6.076M prior.
Elsewhere, US Dollar Index (DXY) fades bounce off two-month low as it retreats to 101.82 by the press time amid recently increased odds of the US Federal Reserve’s (Fed) no rate hike in May. It should be noted that downbeat US data allowed the hawkish Fed bets to reverse earlier in the week.
After a disappointing 19-month low of the US JOLTS Job Openings for February, the ADP Employment Change for March dropped to 145K from 200K expected and an upwardly revised prior of 261K. On the same line, the final readings of S&P Global Composite and Services PMIs for March also came in downbeat as the former one declined to 52.3 from 53.3 preliminary estimations while the Services PMI dropped to 52.6 from 53.8 anticipated earlier. More importantly, the US ISM Services PMI for the said month amplified pessimism as it dropped to 51.2 versus 54.5 expected and 55.1 prior.
It should be noted that CME’s FedWatch Tool suggests a nearly 57.0% of chance that the US central bank will pause its rate hike trajectory in May.
While portraying the mood, S&P 500 Futures print mild losses while tracing the Wall Street benchmarks. However, the yields remain pressured and weigh on the US Dollar. It’s worth noting that the benchmark US 10-year Treasury bond yields dropped in the last five consecutive days to refresh a seven-month low on Wednesday while the two-year counterpart also printed a four-day downtrend before bouncing off 3.79% at the latest.
Moving on, second-tier US employment clues and risk catalysts may entertain WTI crude oil traders ahead of Friday’s key Nonfarm Payrolls (NFP).
A four-month-old resistance line challenges WTI crude oil buyers around $81.80. The likely pullback, however, remains elusive unless the quote stays beyond ascending support line from March 24, close to $79.20 at the latest.
Technical Levels: Supports and Resistances
XTIUSD currently trading at 80.54 at the time of writing. Pair opened at 80.36 and is trading with a change of 0.22 % .
| Overview | Overview.1 | |
|---|---|---|
| 0 | Today last price | 80.54 |
| 1 | Today Daily Change | 0.18 |
| 2 | Today Daily Change % | 0.22 |
| 3 | Today daily open | 80.36 |
The pair is trading above its 20 Daily moving average @ 72.98, above its 50 Daily moving average @ 75.76 , above its 100 Daily moving average @ 76.81 and below its 200 Daily moving average @ 83.21
| Trends | Trends.1 | |
|---|---|---|
| 0 | Daily SMA20 | 72.98 |
| 1 | Daily SMA50 | 75.76 |
| 2 | Daily SMA100 | 76.81 |
| 3 | Daily SMA200 | 83.21 |
The previous day high was 81.25 while the previous day low was 79.75. The daily 38.2% Fib levels comes at 80.32, expected to provide support. Similarly, the daily 61.8% fib level is at 80.67, expected to provide resistance.
Note the levels of interest below:
- Pivot support is noted at 79.66, 78.95, 78.16
- Pivot resistance is noted at 81.16, 81.95, 82.66
| Levels | Levels.1 |
|---|---|
| Previous Daily High | 81.25 |
| Previous Daily Low | 79.75 |
| Previous Weekly High | 75.78 |
| Previous Weekly Low | 69.18 |
| Previous Monthly High | 80.99 |
| Previous Monthly Low | 64.39 |
| Daily Fibonacci 38.2% | 80.32 |
| Daily Fibonacci 61.8% | 80.67 |
| Daily Pivot Point S1 | 79.66 |
| Daily Pivot Point S2 | 78.95 |
| Daily Pivot Point S3 | 78.16 |
| Daily Pivot Point R1 | 81.16 |
| Daily Pivot Point R2 | 81.95 |
| Daily Pivot Point R3 | 82.66 |
[/s2If]
Join Our Telegram Group
")


