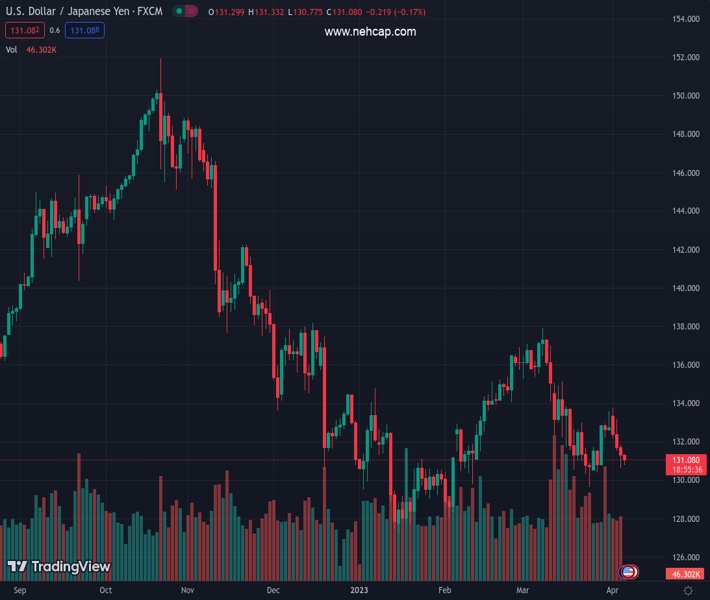
#USDJPY @ 131.158 has rebounded following the footprints of the USD Index amid geopolitical tensions. (Pivot Orderbook analysis)
…
This is a premium post.
[s2If !current_user_can(access_s2member_level4)]Please register for PREMIUM VERSION HERE to read full post below containing analysis. In case of any error or you think you are not able to read the full post below, please email us at support#nehcap.com [lwa][/s2If] [s2If current_user_can(access_s2member_level4)]
- USD/JPY has rebounded following the footprints of the USD Index amid geopolitical tensions.
- China is opposing US collusion with Taiwan and criticizes US McCarthy for breaking the commitment on the Taiwan question.
- S&P500 futures have extended their downside after a two-day losing spell, portraying a dismal market mood.
The pair currently trades last at 131.158.
The previous day high was 131.85 while the previous day low was 130.63. The daily 38.2% Fib levels comes at 131.1, expected to provide support. Similarly, the daily 61.8% fib level is at 131.38, expected to provide resistance.
The USD/JPY pair has witnessed buying interest after slipping below the immediate support of 131.00 in the Asian session. The recovery move in the asset is backed by an extension of reversal in the US Dollar Index (DXY). The USD Index has firmly climbed above the 102.00 resistance and is expected to record more upside amid deepening geopolitical tensions between the United States and China.
S&P500 futures have extended their downside after a two-day losing spell amid escalating geopolitical tensions, portraying a dismal market mood.
Also, the US and South Korea have been accused of stoking nuclear war tensions by North Korea after their joint military drills operation, as reported by Reuters. China is opposing US collusion with Taiwan and criticizes US House Speaker McCarthy for breaking the commitment made by the US to China on the Taiwan question.
The US Dollar Index (DXY) is attracting bids amid improvement in its safe-haven appeal amid geopolitical tensions. Also, investors are getting anxious ahead of the release of the United States Nonfarm Payrolls (NFP) data. Meanwhile, the 10-year US Treasury yields have also recovered to 3.31%.
USD/JPY is defending further downside after dragging to near the 61.8% Fibonacci retracement (placed from March 24 low at 129.64 to April 03 high at 133.76) at 131.22 on an hourly scale. The 20-period Exponential Moving Average (EMA) at 131.30 is still acting as a barricade for the US Dollar bulls.
Meanwhile, the Relative Strength Index (RSI) (14) is making efforts in climbing into the 40.00-60.00 range.
Should the asset break above the immediate resistance of 131.50, US Dollar bulls would drive the asset towards 38.2% Fibo retracement at 132.19 followed by April 04 high at 133.17.
On the contrary, a break below April 05 low at 130.63 would drag the asset towards the round-level support of 130.00. A break below the 130.00 support would expose the asset to March 24 low at 129.64.
Technical Levels: Supports and Resistances
USDJPY currently trading at 131.23 at the time of writing. Pair opened at 131.32 and is trading with a change of -0.07 % .
| Overview | Overview.1 | |
|---|---|---|
| 0 | Today last price | 131.23 |
| 1 | Today Daily Change | -0.09 |
| 2 | Today Daily Change % | -0.07 |
| 3 | Today daily open | 131.32 |
The pair remains strongly bearish on the daily time frame. It trades below the 20 SMA @ 132.52, 50 SMA 133.05, 100 SMA @ 133.64 and 200 SMA @ 137.26.
| Trends | Trends.1 | |
|---|---|---|
| 0 | Daily SMA20 | 132.52 |
| 1 | Daily SMA50 | 133.05 |
| 2 | Daily SMA100 | 133.64 |
| 3 | Daily SMA200 | 137.26 |
The previous day high was 131.85 while the previous day low was 130.63. The daily 38.2% Fib levels comes at 131.1, expected to provide support. Similarly, the daily 61.8% fib level is at 131.38, expected to provide resistance.
Note the levels of interest below:
- Pivot support is noted at 130.68, 130.05, 129.47
- Pivot resistance is noted at 131.9, 132.48, 133.11
| Levels | Levels.1 |
|---|---|
| Previous Daily High | 131.85 |
| Previous Daily Low | 130.63 |
| Previous Weekly High | 133.60 |
| Previous Weekly Low | 130.41 |
| Previous Monthly High | 137.91 |
| Previous Monthly Low | 129.64 |
| Daily Fibonacci 38.2% | 131.10 |
| Daily Fibonacci 61.8% | 131.38 |
| Daily Pivot Point S1 | 130.68 |
| Daily Pivot Point S2 | 130.05 |
| Daily Pivot Point S3 | 129.47 |
| Daily Pivot Point R1 | 131.90 |
| Daily Pivot Point R2 | 132.48 |
| Daily Pivot Point R3 | 133.11 |
[/s2If]
Join Our Telegram Group
")


