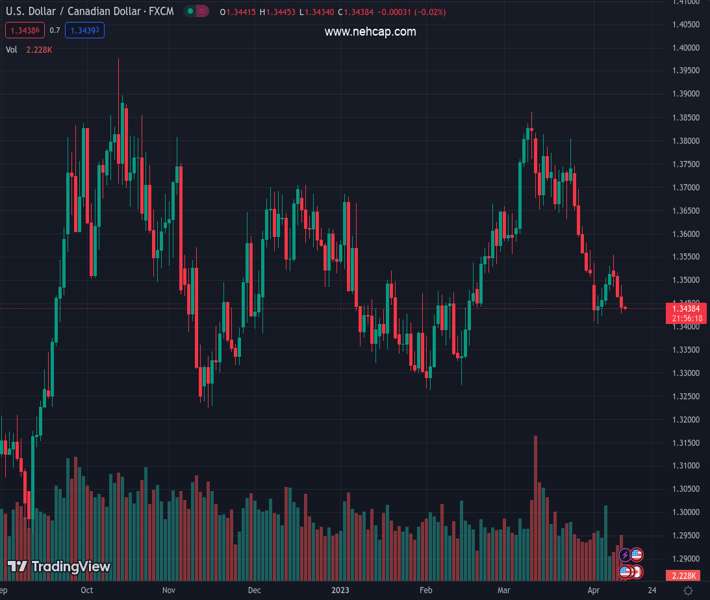
#USDCAD @ 1.34543 struggles to extend the previous day’s rebound from seven-week low., @nehcap view: Further recovery expected (Pivot Orderbook analysis)
…
This is a premium post.
[s2If !current_user_can(access_s2member_level4)]Please register for PREMIUM VERSION HERE to read full post below containing analysis. In case of any error or you think you are not able to read the full post below, please email us at support#nehcap.com [lwa][/s2If] [s2If current_user_can(access_s2member_level4)]
- USD/CAD struggles to extend the previous day’s rebound from seven-week low.
- One-week-old descending resistance line challenge Loonie pair buyers.
- Bullish MACD signals, RSI recovery from oversold territory facilitates upside momentum.
The pair currently trades last at 1.34543.
The previous day high was 1.3467 while the previous day low was 1.3406. The daily 38.2% Fib levels comes at 1.3444, expected to provide support. Similarly, the daily 61.8% fib level is at 1.3429, expected to provide support.
USD/CAD picks up bids to refresh intraday high near 1.3455 as bulls poke a downward-sloping resistance line from the previous Tuesday.
Adding strength to the recovery moves are the bullish MACD signals and the RSI (14) recovery from the oversold territory, which in turn suggests continuation of the latest rebound.
With this, the Loonie pair buyers are ready to break the immediate hurdle surrounding 1.3460.
Following that, the 61.8% Fibonacci retracement level of February-March upside, near 1.3490 and the 1.3500 round figure could challenge USD/CAD buyers.
In a case where the Loonie pair remains firmer past 1.3500, it can quickly jump to the 50% Fibonacci retracement level of around 1.3560. However, a convergence of the previous support line from early February and the 200-SMA, around 1.3635 at the latest, appears a tough nut to crack for the USD/USD bulls afterward.
On the flip side, the recent low of 1.3405 and the 1.3400 round figure can join the downbeat RSI conditions to challenge the intraday sellers of the USD/CAD pair.
Also acting as the near-term downside filters are the multiple lows marked during early February around 1.3380 and 1.3320.
It’s worth noting that the Year-To-Date low marked in February near 1.3265 acts as the last defense of the USD/CAD buyers.
Trend: Further recovery expected
Technical Levels: Supports and Resistances
USDCAD currently trading at 1.3455 at the time of writing. Pair opened at 1.3445 and is trading with a change of 0.07% % .
| Overview | Overview.1 | |
|---|---|---|
| 0 | Today last price | 1.3455 |
| 1 | Today Daily Change | 0.0010 |
| 2 | Today Daily Change % | 0.07% |
| 3 | Today daily open | 1.3445 |
The pair is trading below its 20 Daily moving average @ 1.367, below its 50 Daily moving average @ 1.3546 , below its 100 Daily moving average @ 1.3524 and above its 200 Daily moving average @ 1.3381
| Trends | Trends.1 | |
|---|---|---|
| 0 | Daily SMA20 | 1.3670 |
| 1 | Daily SMA50 | 1.3546 |
| 2 | Daily SMA100 | 1.3524 |
| 3 | Daily SMA200 | 1.3381 |
The previous day high was 1.3467 while the previous day low was 1.3406. The daily 38.2% Fib levels comes at 1.3444, expected to provide support. Similarly, the daily 61.8% fib level is at 1.3429, expected to provide support.
Note the levels of interest below:
- Pivot support is noted at 1.3411, 1.3378, 1.335
- Pivot resistance is noted at 1.3473, 1.3501, 1.3535
| Levels | Levels.1 |
|---|---|
| Previous Daily High | 1.3467 |
| Previous Daily Low | 1.3406 |
| Previous Weekly High | 1.3745 |
| Previous Weekly Low | 1.3508 |
| Previous Monthly High | 1.3862 |
| Previous Monthly Low | 1.3508 |
| Daily Fibonacci 38.2% | 1.3444 |
| Daily Fibonacci 61.8% | 1.3429 |
| Daily Pivot Point S1 | 1.3411 |
| Daily Pivot Point S2 | 1.3378 |
| Daily Pivot Point S3 | 1.3350 |
| Daily Pivot Point R1 | 1.3473 |
| Daily Pivot Point R2 | 1.3501 |
| Daily Pivot Point R3 | 1.3535 |
[/s2If]
Join Our Telegram Group
")


