#USDCAD @ 1.34427 struggles to capitalize on its modest gains amid the emergence of fresh USD selling. (Pivot Orderbook analysis)
…
This is a premium post.
[s2If !current_user_can(access_s2member_level4)]Please register for PREMIUM VERSION HERE to read full post below containing analysis. In case of any error or you think you are not able to read the full post below, please email us at support#nehcap.com [lwa][/s2If] [s2If current_user_can(access_s2member_level4)]
- USD/CAD struggles to capitalize on its modest gains amid the emergence of fresh USD selling.
- The weaker ADP report lifts bets for an imminent Fed rate-hike pause and weighs on the buck.
- The downside seems limited ahead of Canadian jobs data on Thursday and Friday’s NFP report.
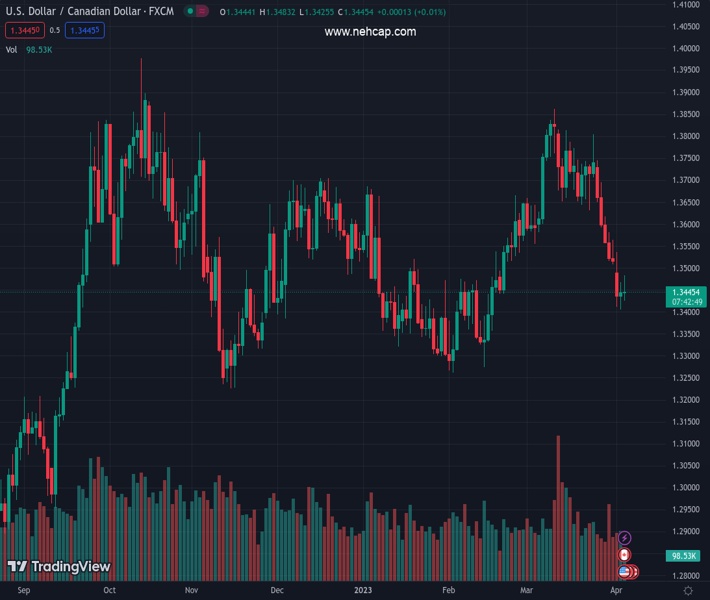
The pair currently trades last at 1.34427.
The previous day high was 1.3467 while the previous day low was 1.3406. The daily 38.2% Fib levels comes at 1.3444, expected to provide resistance. Similarly, the daily 61.8% fib level is at 1.3429, expected to provide support.
The USD/CAD pair builds on the previous day’s bounce from the 1.3400 mark, or its lowest level since February 16 and edges higher for the second successive day on Wednesday. The intraday positive move, however, runs out of steam ahead of the 100-hour Simple Moving Average (SMA), forcing spot prices to retreat below mid-1.3400s during the early North American session.
Crude Oil prices struggle to capitalize on this week’s big bullish gap opening and the subsequent move up to the highest level since January 17 amid worries that looming recession risks will dent fuel demand. This, in turn, undermines the commodity-linked Loonie and lends some support to the USD/CAD pair. The US Dollar, on the other hand, struggles to capitalize on its modest intraday recovery from over a two-month low, which, in turn, caps the upside for the pair.
Growing acceptance that the Federal Reserve (Fed) is nearly done with its tightening cycle keeps a lid on any meaningful rally in the US bond yields and holds back the USD bulls from placing aggressive bets. In fact, the markets are now pricing in an even chance of a 25 bps lift-off at the May FOMC meeting and the possibility of rate cuts by end-December. The bets were reaffirmed by the incoming softer US macro releases, including the US ADP report on Wednesday.
According to the data published by Automatic Data Processing, the US private-sector employers added 145K jobs in March as compared to the 200K expected and the previous month’s upwardly revised reading of 261 K. This comes on the back of the JOLTS report released on Tuesday, which indicated that job openings in February dropped to the lowest in nearly two years. This is seen as a sign that the Fed’s efforts to slow the labor market may be having some impact.
Apart from this, looming recession risks reinforce speculations that the Fed might soon pause its inflation-fighting rate hikes, which suggests that the path of least resistance for the USD is to the downside. That said, a softer risk tone could lend some support to the safe-haven buck and help limit the downside for the USD/CAD pair. Traders might also refrain from placing aggressive bets ahead of Thursday’s release of Canadian jobs data and the US NFP report on Friday.
Technical Levels: Supports and Resistances
USDCAD currently trading at 1.3449 at the time of writing. Pair opened at 1.3445 and is trading with a change of 0.03 % .
| Overview | Overview.1 | |
|---|---|---|
| 0 | Today last price | 1.3449 |
| 1 | Today Daily Change | 0.0004 |
| 2 | Today Daily Change % | 0.0300 |
| 3 | Today daily open | 1.3445 |
The pair is trading below its 20 Daily moving average @ 1.367, below its 50 Daily moving average @ 1.3546 , below its 100 Daily moving average @ 1.3524 and above its 200 Daily moving average @ 1.3381
| Trends | Trends.1 | |
|---|---|---|
| 0 | Daily SMA20 | 1.3670 |
| 1 | Daily SMA50 | 1.3546 |
| 2 | Daily SMA100 | 1.3524 |
| 3 | Daily SMA200 | 1.3381 |
The previous day high was 1.3467 while the previous day low was 1.3406. The daily 38.2% Fib levels comes at 1.3444, expected to provide resistance. Similarly, the daily 61.8% fib level is at 1.3429, expected to provide support.
Note the levels of interest below:
- Pivot support is noted at 1.3411, 1.3378, 1.335
- Pivot resistance is noted at 1.3473, 1.3501, 1.3535
| Levels | Levels.1 |
|---|---|
| Previous Daily High | 1.3467 |
| Previous Daily Low | 1.3406 |
| Previous Weekly High | 1.3745 |
| Previous Weekly Low | 1.3508 |
| Previous Monthly High | 1.3862 |
| Previous Monthly Low | 1.3508 |
| Daily Fibonacci 38.2% | 1.3444 |
| Daily Fibonacci 61.8% | 1.3429 |
| Daily Pivot Point S1 | 1.3411 |
| Daily Pivot Point S2 | 1.3378 |
| Daily Pivot Point S3 | 1.3350 |
| Daily Pivot Point R1 | 1.3473 |
| Daily Pivot Point R2 | 1.3501 |
| Daily Pivot Point R3 | 1.3535 |
[/s2If]
Join Our Telegram Group
")


