The US EIA reports a 3.7 million barrel drop in inventories, with gasoline and distillates falling even more than estimated. (Pivot Orderbook analysis)
…
This is a premium post.
[s2If !current_user_can(access_s2member_level4)]Please register for PREMIUM VERSION HERE to read full post below containing analysis. In case of any error or you think you are not able to read the full post below, please email us at support#nehcap.com [lwa][/s2If] [s2If current_user_can(access_s2member_level4)]
- The US EIA reports a 3.7 million barrel drop in inventories, with gasoline and distillates falling even more than estimated.
- Global Manufacturing and Services PMIs suggest a potential economic slump, adding pressure to WTI prices.
The pair currently trades last at 80.36.
The previous day high was 81.81 while the previous day low was 79.63. The daily 38.2% Fib levels comes at 80.97, expected to provide resistance. Similarly, the daily 61.8% fib level is at 80.46, expected to provide resistance.
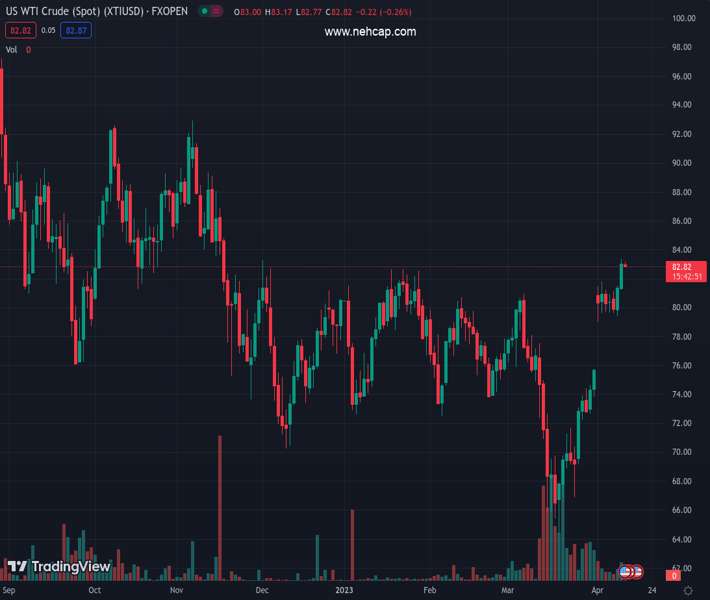
Western Texas Intermediate (WTI), the US crude oil benchmark, retreats from weekly highs at $81.75 and drops on greater-than-expected reductions in US crude and fuel stockpiles. Investors’ speculations that a Fed pivot is likely to happen as recession fears grow turned flows towards the US Dollar. At the time of typing, WTI is trading at around $80.30.
Data from the US Energy Information Administration (EIA) office showed that inventories fell by 3.7 million barrels. In comparison, gasoline and distillates dropped more than estimates by 4.1 million barrels and 3.6 million barrels, respectively.
US crude oil prices jumped over the weekend, highlighting the Organization of Petroleum Exporting Countries (OPEC) decision to cut output by 1 million barrels.
Also weighing on WTI price are the recent readings of Global Manufacturing and Services PMIs, indicating that the economy might slump worldwide.
The latest data in the United States (US) showed that business activity is slowing down while the labor market is catching up with the Fed’s cumulative tightening. Therefore, traders estimate a pause in the US central bank tightening campaign, with over a 50% chance of keeping rates unchanged.
Job openings in the US fell to their lowest in almost two years, according to the JOLTs report. The market participants focus on Thursday’s Initial Jobless Claims data, followed by Friday’s Nonfarm Payrolls.
WTI remains braced to the $80.00 per barrel figure on sideways trading. Price action during the last week remains almost flat. The Relative Strength Index (RSI) persists in bullish territory and shifts flat. At the same time, the Rate of Change (RoC) portrays that buying pressure is waning. If WTI resumes upwards, the first resistance would be $81.00. A breach of the latter will expose the November 7 pivot high at $93.73. On the flip side, WTI’s would dip, towards $75.00, if sellers reclaim the $80.00 PB psychological level.
Technical Levels: Supports and Resistances
XTIUSD currently trading at 80.36 at the time of writing. Pair opened at 81.02 and is trading with a change of -0.81 % .
| Overview | Overview.1 | |
|---|---|---|
| 0 | Today last price | 80.36 |
| 1 | Today Daily Change | -0.66 |
| 2 | Today Daily Change % | -0.81 |
| 3 | Today daily open | 81.02 |
The pair is trading above its 20 Daily moving average @ 72.79, above its 50 Daily moving average @ 75.76 , above its 100 Daily moving average @ 76.85 and below its 200 Daily moving average @ 83.35
| Trends | Trends.1 | |
|---|---|---|
| 0 | Daily SMA20 | 72.79 |
| 1 | Daily SMA50 | 75.76 |
| 2 | Daily SMA100 | 76.85 |
| 3 | Daily SMA200 | 83.35 |
The previous day high was 81.81 while the previous day low was 79.63. The daily 38.2% Fib levels comes at 80.97, expected to provide resistance. Similarly, the daily 61.8% fib level is at 80.46, expected to provide resistance.
Note the levels of interest below:
- Pivot support is noted at 79.83, 78.65, 77.66
- Pivot resistance is noted at 82.0, 82.99, 84.18
| Levels | Levels.1 |
|---|---|
| Previous Daily High | 81.81 |
| Previous Daily Low | 79.63 |
| Previous Weekly High | 75.78 |
| Previous Weekly Low | 69.18 |
| Previous Monthly High | 80.99 |
| Previous Monthly Low | 64.39 |
| Daily Fibonacci 38.2% | 80.97 |
| Daily Fibonacci 61.8% | 80.46 |
| Daily Pivot Point S1 | 79.83 |
| Daily Pivot Point S2 | 78.65 |
| Daily Pivot Point S3 | 77.66 |
| Daily Pivot Point R1 | 82.00 |
| Daily Pivot Point R2 | 82.99 |
| Daily Pivot Point R3 | 84.18 |
[/s2If]
Join Our Telegram Group
")


