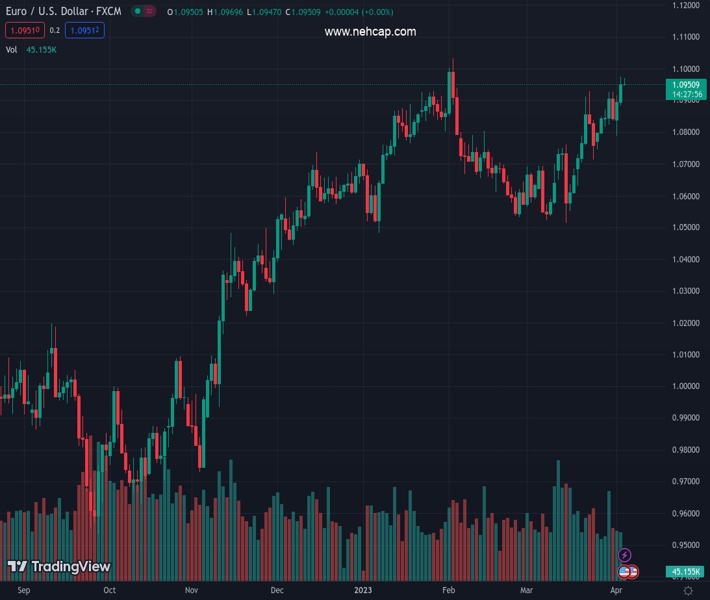
#EURUSD @ 1.09527 is hovering around 1.0960 as investors have sidelined ahead of the US labor market and Services PMI data. (Pivot Orderbook analysis)
…
This is a premium post.
[s2If !current_user_can(access_s2member_level4)]Please register for PREMIUM VERSION HERE to read full post below containing analysis. In case of any error or you think you are not able to read the full post below, please email us at support#nehcap.com [lwa][/s2If] [s2If current_user_can(access_s2member_level4)]
- EUR/USD is hovering around 1.0960 as investors have sidelined ahead of the US labor market and Services PMI data.
- Federal Reserve might keep rates unchanged to safeguard the US economy from recession.
- Higher rates from European Central Bank have trimmed annual consumer inflation expectations.
- EUR/USD is approaching the critical resistance of 1.1033, auctioning in a Rising Channel pattern.
The pair currently trades last at 1.09527.
The previous day high was 1.0973 while the previous day low was 1.0883. The daily 38.2% Fib levels comes at 1.0939, expected to provide support. Similarly, the daily 61.8% fib level is at 1.0917, expected to provide support.
EUR/USD is continuously trading sideways around 1.0960 following the footprints of the US Dollar Index (DXY). The major currency pair is struggling to find a decisive move as investors are likely to show interest after the release of the United States Automatic Data Processing (ADP) Employment and ISM Services PMI data.
S&P500 futures have turned negative after some minimal gains in the Asian session, portraying a further decline in the risk appetite of the market participants. US equities witnessed selling pressure on Tuesday as the release of the downbeat US Job Openings data after declining Manufacturing activities triggered the risk of recession.
Meanwhile, the US Dollar Index (DXY) has shown a modest recovery after refreshing its monthly low at 101.45 being supported by firmer US Treasury yields. The demand for US government bonds has turned subdued despite the rising chances of a steady monetary policy by the Federal Reserve (Fed). The 10-year US Treasury yields have rebounded to near 3.35%.
One major reason that has been driving US interest rates higher for the past year and keeping inflationary pressures stubborn is the tight labor market. Shortage of labor was loading households with stellar funds, which was keeping the retail demand upbeat and prices of goods and services were not coming down.
On Tuesday, the US Job Openings data displayed the economic data for demand for labor below 10 million for the first time since 2021. This allowed the contracting US Manufacturing sector to join hands with the declining demand for labor and conveyed the message of cooling the US labor market due to a bleak economic outlook.
Back-to-back weak economic data is deepening fears of a recession in the US economy. Therefore the street is anticipating an early pause to the policy-tightening spell by the Federal Reserve. As per the CME Fedwatch tool, investors are advocating an unchanged interest rate decision for May’s monetary policy meeting.
The release of the US ADP Employment data would provide significant guidance about the condition of the US labor market. As per the consensus, the US economy has made fresh additions of 200K jobs in March versus. 242K jobs added in February.
Also, the release of the US ISM Services PMI data will provide major clarity. The US Manufacturing sector has been contracting for the past five months as a figure below 50.0 is considered a contraction. And, contraction in the services sector would stem anticipation of contracting Gross Domestic Product (GDP) on a quarterly basis. The US ISM Services PMI (Mar) is expected to contract to 54.5 from the former release of 55.1. Also, New Orders Index that reflects forward-demand would drop to 57.6 from the prior release of 62.6.
In Eurozone, the survey of consumer expectations for inflation, conducted by the European Central Bank (ECB) on a monthly basis showed that median inflation expectations for the next 12 months have fallen to 4.6% in February vs. 4.9% recorded in January. Constantly rising rates by European Central Bank President Christine Lagarde to tame sticky Eurozone inflation has trimmed consumer inflation expectations.
However, the economic data is ex-discounted of the recent jump in oil prices, which carries the potential of spurting global inflation. The Eurozone economy is highly dependent on the import of oil, which could result in a rebound in the inflation pressures and could put the shared continent back to square.
Apart from that, expectations for economic growth over the next 12 months became less negative, and expectations for the unemployment rate in 12 months have decreased.
EUR/USD is marching towards the horizontal resistance plotted from February 01 high at 1.1033 on a four-hour scale. The shared currency pair is auctioning in a Rising Channel chart pattern in which each pullback is considered a buying opportunity by the market participants.
Upward-sloping 10-and 20-period Exponential Moving Averages (EMAs) at 1.0931 and 1.0904 respectively indicate that the bullish momentum is extremely strong.
The Relative Strength Index (RSI) (14) is oscillating in the bullish range of 60.00-80.00, showing active upside momentum.
Technical Levels: Supports and Resistances
EURUSD currently trading at 1.0958 at the time of writing. Pair opened at 1.0953 and is trading with a change of 0.05 % .
| Overview | Overview.1 | |
|---|---|---|
| 0 | Today last price | 1.0958 |
| 1 | Today Daily Change | 0.0005 |
| 2 | Today Daily Change % | 0.0500 |
| 3 | Today daily open | 1.0953 |
The pair remains strongly bullish on the daily timeframe. It trades above its 20 SMA @ 1.0755, 50 SMA 1.0734, 100 SMA @ 1.0663 and 200 SMA @ 1.0345.
| Trends | Trends.1 | |
|---|---|---|
| 0 | Daily SMA20 | 1.0755 |
| 1 | Daily SMA50 | 1.0734 |
| 2 | Daily SMA100 | 1.0663 |
| 3 | Daily SMA200 | 1.0345 |
The previous day high was 1.0973 while the previous day low was 1.0883. The daily 38.2% Fib levels comes at 1.0939, expected to provide support. Similarly, the daily 61.8% fib level is at 1.0917, expected to provide support.
Note the levels of interest below:
- Pivot support is noted at 1.09, 1.0846, 1.0809
- Pivot resistance is noted at 1.099, 1.1027, 1.1081
| Levels | Levels.1 |
|---|---|
| Previous Daily High | 1.0973 |
| Previous Daily Low | 1.0883 |
| Previous Weekly High | 1.0926 |
| Previous Weekly Low | 1.0745 |
| Previous Monthly High | 1.0930 |
| Previous Monthly Low | 1.0516 |
| Daily Fibonacci 38.2% | 1.0939 |
| Daily Fibonacci 61.8% | 1.0917 |
| Daily Pivot Point S1 | 1.0900 |
| Daily Pivot Point S2 | 1.0846 |
| Daily Pivot Point S3 | 1.0809 |
| Daily Pivot Point R1 | 1.0990 |
| Daily Pivot Point R2 | 1.1027 |
| Daily Pivot Point R3 | 1.1081 |
[/s2If]
Join Our Telegram Group
")


