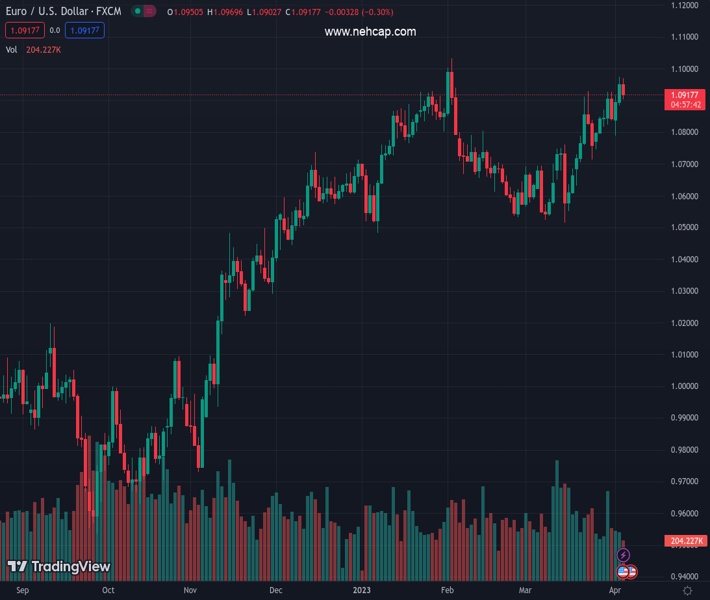
#EURUSD @ 1.09187 US Dollar gains momentum during the American session. (Pivot Orderbook analysis)
…
This is a premium post.
[s2If !current_user_can(access_s2member_level4)]Please register for PREMIUM VERSION HERE to read full post below containing analysis. In case of any error or you think you are not able to read the full post below, please email us at support#nehcap.com [lwa][/s2If] [s2If current_user_can(access_s2member_level4)]
- US Dollar gains momentum during the American session.
- US data points to a slowdown in activity, hiring and also, inflation.
- EUR/USD down for the day, moves away from two-month highs.
The pair currently trades last at 1.09187.
The previous day high was 1.0973 while the previous day low was 1.0883. The daily 38.2% Fib levels comes at 1.0939, expected to provide resistance. Similarly, the daily 61.8% fib level is at 1.0917, expected to provide support.
The EUR/USD corrected to the 1.0900 zone after the beginning of the American session and despite weaker-than-expected US economic data. The US Dollar gained momentum, pushing the pair to the downside.
Automatic Data Processing (ADP) released its employment report showing that in March the private sector added 145K jobs, below expectations of 200K. The US Dollar dropped after the report but later, following the ISM Service, PMI turned decisively higher for the day.
The ISM Service PMI came in at 51.2 in March, a bigger-than-expected slowdown from the 55.1 of February, and below market expectations of 54.5. The Employment Index fell to 51.3 from 54 and the Price Paid fell from 65.6 to 59.5. The report shows activity expanding at a modest pace with inflation indicators retreating further.
Despite the fact that the economic figures offer arguments for the monetary policy doves the US Dollar gained momentum, even as US yields printed fresh lows.
The EUR/USD is hovering around 1.0920. The slide from the 1.0970 area is seen as a correction so far. Below 1.0900, the next support stands at 1.0870. On the upside, if the Euro retakes 1.0950, it could likely rise to test the 1.0970 zone again.
Technical Levels: Supports and Resistances
EURUSD currently trading at 1.0915 at the time of writing. Pair opened at 1.0953 and is trading with a change of -0.35 % .
| Overview | Overview.1 | |
|---|---|---|
| 0 | Today last price | 1.0915 |
| 1 | Today Daily Change | -0.0038 |
| 2 | Today Daily Change % | -0.3500 |
| 3 | Today daily open | 1.0953 |
The pair remains strongly bullish on the daily timeframe. It trades above its 20 SMA @ 1.0755, 50 SMA 1.0734, 100 SMA @ 1.0663 and 200 SMA @ 1.0345.
| Trends | Trends.1 | |
|---|---|---|
| 0 | Daily SMA20 | 1.0755 |
| 1 | Daily SMA50 | 1.0734 |
| 2 | Daily SMA100 | 1.0663 |
| 3 | Daily SMA200 | 1.0345 |
The previous day high was 1.0973 while the previous day low was 1.0883. The daily 38.2% Fib levels comes at 1.0939, expected to provide resistance. Similarly, the daily 61.8% fib level is at 1.0917, expected to provide support.
Note the levels of interest below:
- Pivot support is noted at 1.09, 1.0846, 1.0809
- Pivot resistance is noted at 1.099, 1.1027, 1.1081
| Levels | Levels.1 |
|---|---|
| Previous Daily High | 1.0973 |
| Previous Daily Low | 1.0883 |
| Previous Weekly High | 1.0926 |
| Previous Weekly Low | 1.0745 |
| Previous Monthly High | 1.0930 |
| Previous Monthly Low | 1.0516 |
| Daily Fibonacci 38.2% | 1.0939 |
| Daily Fibonacci 61.8% | 1.0917 |
| Daily Pivot Point S1 | 1.0900 |
| Daily Pivot Point S2 | 1.0846 |
| Daily Pivot Point S3 | 1.0809 |
| Daily Pivot Point R1 | 1.0990 |
| Daily Pivot Point R2 | 1.1027 |
| Daily Pivot Point R3 | 1.1081 |
[/s2If]
Join Our Telegram Group
")


