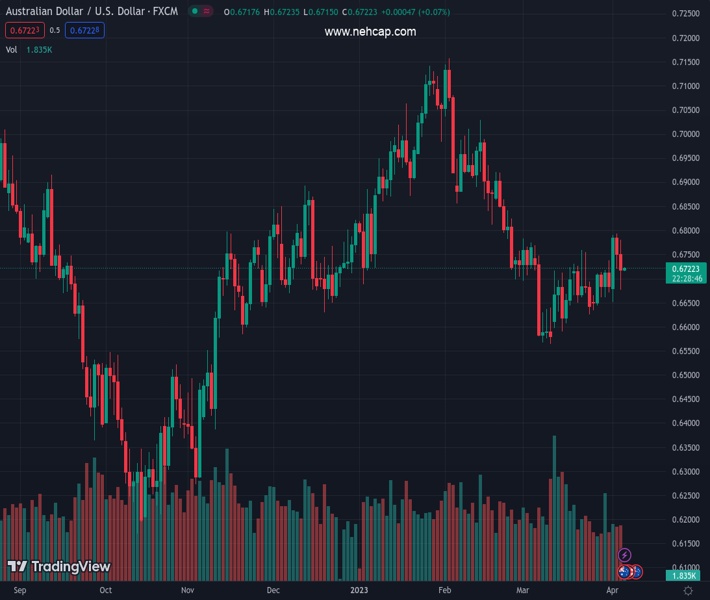
#AUDUSD @ 0.67206 picks up bids to pare recent losses, snaps two-day downtrend. (Pivot Orderbook analysis)
…
This is a premium post.
[s2If !current_user_can(access_s2member_level4)]Please register for PREMIUM VERSION HERE to read full post below containing analysis. In case of any error or you think you are not able to read the full post below, please email us at support#nehcap.com [lwa][/s2If] [s2If current_user_can(access_s2member_level4)]
- AUD/USD picks up bids to pare recent losses, snaps two-day downtrend.
- RBA’s Lowe fails to convince markets of the Aussie central bank’s hawkish capacity after pausing rates.
- US Dollar rebound, sour sentiment also weighs on the risk-barometer pair.
- Australia’s trade numbers, China Caixin Services PMI will be important to watch for clear directions.
The pair currently trades last at 0.67206.
The previous day high was 0.6793 while the previous day low was 0.6721. The daily 38.2% Fib levels comes at 0.6748, expected to provide resistance. Similarly, the daily 61.8% fib level is at 0.6766, expected to provide resistance.
AUD/USD picks up bids to pare recent losses around 0.6720 as it braces for the Aussie foreign trade numbers for February and China’s Caixin Services PMI for March on early Thursday. The Aussie pair dropped in the last two consecutive days despite softer US data as the Reserve Bank of Australia’s (RBA) pause to the rate hike trajectory pushed back the bulls even if Governor Philip Lowe tried to recall them.
On Wednesday, Reserve Bank of Australia (RBA) Governor Philip Lowe tried to appease hawks, following the RBA’s pause in rate hikes. The Policymaker ruled out rate cuts while also saying, “Balance of risks lean toward further rate rises.”
On the other hand, the US Dollar rebound amid recession woes and ignored the downbeat data. That said, the ADP Employment Change for March dropped to 145K from 200K expected and an upwardly revised prior of 261K. On the same line, the final readings of S&P Global Composite and Services PMIs for March also came in downbeat as the former one declined to 52.3 from 53.3 preliminary estimations while the Services PMI dropped to 52.6 from 53.8 anticipated earlier. More importantly, the US ISM Services PMI for the said month amplified pessimism as it dropped to 51.2 versus 54.5 expected and 55.1 prior.
Against this backdrop, the recession woes in the US grew stronger and weighed on the sentiment. The same marked downbeat Wall Street close and drowned the US Treasury bond yields. However, the sour sentiment allowed the US Dollar Index (DXY) to recover from a two-month low and snap a two-day downtrend.
Looking ahead, Australia’s monthly Trade Balance, Exports and Imports for February will precede China’s Caixin Services PMI for March to direct immediate AUD/USD moves. Given the dovish RBA, the Aussie pair is likely to remain pressured unless the data provides positive surprise.
A daily closing below one-month-old support line near 0.6680 becomes necessary for the AUD/USD bears to retake control.
Technical Levels: Supports and Resistances
AUDUSD currently trading at 0.6722 at the time of writing. Pair opened at 0.6751 and is trading with a change of -0.43 % .
| Overview | Overview.1 | |
|---|---|---|
| 0 | Today last price | 0.6722 |
| 1 | Today Daily Change | -0.0029 |
| 2 | Today Daily Change % | -0.4300 |
| 3 | Today daily open | 0.6751 |
The pair is trading above its 20 Daily moving average @ 0.6673, below its 50 Daily moving average @ 0.6809 , below its 100 Daily moving average @ 0.68 and below its 200 Daily moving average @ 0.675
| Trends | Trends.1 | |
|---|---|---|
| 0 | Daily SMA20 | 0.6673 |
| 1 | Daily SMA50 | 0.6809 |
| 2 | Daily SMA100 | 0.6800 |
| 3 | Daily SMA200 | 0.6750 |
The previous day high was 0.6793 while the previous day low was 0.6721. The daily 38.2% Fib levels comes at 0.6748, expected to provide resistance. Similarly, the daily 61.8% fib level is at 0.6766, expected to provide resistance.
Note the levels of interest below:
- Pivot support is noted at 0.6717, 0.6682, 0.6644
- Pivot resistance is noted at 0.679, 0.6828, 0.6862
| Levels | Levels.1 |
|---|---|
| Previous Daily High | 0.6793 |
| Previous Daily Low | 0.6721 |
| Previous Weekly High | 0.6738 |
| Previous Weekly Low | 0.6634 |
| Previous Monthly High | 0.6784 |
| Previous Monthly Low | 0.6564 |
| Daily Fibonacci 38.2% | 0.6748 |
| Daily Fibonacci 61.8% | 0.6766 |
| Daily Pivot Point S1 | 0.6717 |
| Daily Pivot Point S2 | 0.6682 |
| Daily Pivot Point S3 | 0.6644 |
| Daily Pivot Point R1 | 0.6790 |
| Daily Pivot Point R2 | 0.6828 |
| Daily Pivot Point R3 | 0.6862 |
[/s2If]
Join Our Telegram Group
")


