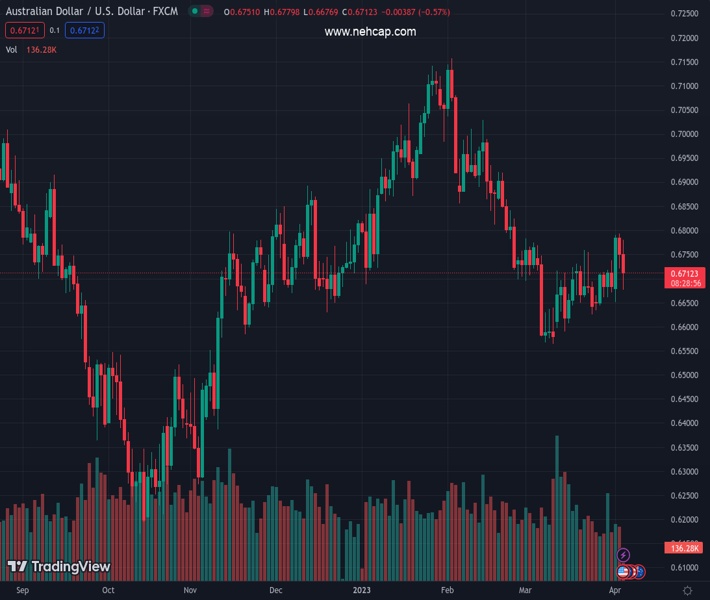
#AUDUSD @ 0.67094 drifts lower for the second straight day and is pressured by a combination of factors. (Pivot Orderbook analysis)
…
This is a premium post.
[s2If !current_user_can(access_s2member_level4)]Please register for PREMIUM VERSION HERE to read full post below containing analysis. In case of any error or you think you are not able to read the full post below, please email us at support#nehcap.com [lwa][/s2If] [s2If current_user_can(access_s2member_level4)]
- AUD/USD drifts lower for the second straight day and is pressured by a combination of factors.
- The RBA’s dovish outlook continues to weigh on the Aussie amid a modest intraday USD uptick.
- The disappointing ADP report reaffirmed bets for Fed rate-hike pause and caps the Greenback.
The pair currently trades last at 0.67094.
The previous day high was 0.6793 while the previous day low was 0.6721. The daily 38.2% Fib levels comes at 0.6748, expected to provide resistance. Similarly, the daily 61.8% fib level is at 0.6766, expected to provide resistance.
The AUD/USD pair comes under heavy selling pressure on Wednesday and extends the previous day’s retracement slide from the vicinity of the 0.6800 mark, or its highest level since February 24. Spot prices, however, manage to recover a few pips from the daily low and trade around the 0.6700 round figure during the early North American session.
The Australian Dollar continues to be weighed down by the Reserve Bank of Australia’s (RBA) dovish outlook, which, along with a modest US Dollar (USD) rebound from over a two-month low, drag the AUD/USD pair lower for the second straight day. It is worth recalling that the Australian central bank on Tuesday paused its rate-hiking cycle following 10 consecutive raises and signalled that inflation had likely peaked. In the accompanying policy statement, the RBA noted that it wanted additional time to assess the full effects of rate increases as the economy slows.
The USD, on the other hand, draws some support from an intraday uptick in the US Treasury bond yields, though lacks bullish conviction amid expectations that the Federal Reserve (Fed) is nearly done with its tightening cycle. In fact, the current market pricing indicates an even chance of a 25 bps lift-off at the May FOMC meeting and the possibility of rate cuts by end-December. The bets were reaffirmed by the disappointing release of the US ADP report, showing that private-sector employers added 145K jobs in March, down sharply from the 261K in the previous month.
This comes on the back of the monthly Job Openings and Labor Turnover Survey, or JOLTS report, which indicated that job openings in February dropped to the lowest in nearly two years. This is seen as a sign that the Fed’s efforts to slow the labor market may be having some impact. Apart from this, looming recession risks reinforce speculations that the Fed might soon pause its inflation-fighting rate hikes, which caps the upside for the US bond yields. This, in turn, is holding back the USD bulls from placing aggressive bets and lending some support to the AUD/USD pair.
Moving ahead, traders now look to the release of the US ISM Services PMI for a fresh impetus. The focus, however, will remain on the closely-watched US monthly employment details, popularly known as the NFP report, on Friday. Nevertheless, the aforementioned mixed fundamental backdrop warrants some caution before positioning for any meaningful corrective downfall for the AUD/USD pair.
Technical Levels: Supports and Resistances
AUDUSD currently trading at 0.6701 at the time of writing. Pair opened at 0.6751 and is trading with a change of -0.74 % .
| Overview | Overview.1 | |
|---|---|---|
| 0 | Today last price | 0.6701 |
| 1 | Today Daily Change | -0.0050 |
| 2 | Today Daily Change % | -0.7400 |
| 3 | Today daily open | 0.6751 |
The pair is trading above its 20 Daily moving average @ 0.6673, below its 50 Daily moving average @ 0.6809 , below its 100 Daily moving average @ 0.68 and below its 200 Daily moving average @ 0.675
| Trends | Trends.1 | |
|---|---|---|
| 0 | Daily SMA20 | 0.6673 |
| 1 | Daily SMA50 | 0.6809 |
| 2 | Daily SMA100 | 0.6800 |
| 3 | Daily SMA200 | 0.6750 |
The previous day high was 0.6793 while the previous day low was 0.6721. The daily 38.2% Fib levels comes at 0.6748, expected to provide resistance. Similarly, the daily 61.8% fib level is at 0.6766, expected to provide resistance.
Note the levels of interest below:
- Pivot support is noted at 0.6717, 0.6682, 0.6644
- Pivot resistance is noted at 0.679, 0.6828, 0.6862
| Levels | Levels.1 |
|---|---|
| Previous Daily High | 0.6793 |
| Previous Daily Low | 0.6721 |
| Previous Weekly High | 0.6738 |
| Previous Weekly Low | 0.6634 |
| Previous Monthly High | 0.6784 |
| Previous Monthly Low | 0.6564 |
| Daily Fibonacci 38.2% | 0.6748 |
| Daily Fibonacci 61.8% | 0.6766 |
| Daily Pivot Point S1 | 0.6717 |
| Daily Pivot Point S2 | 0.6682 |
| Daily Pivot Point S3 | 0.6644 |
| Daily Pivot Point R1 | 0.6790 |
| Daily Pivot Point R2 | 0.6828 |
| Daily Pivot Point R3 | 0.6862 |
[/s2If]
Join Our Telegram Group
")


