#XAGUSD @ 24.094 surpasses monthly highs amid positive market sentiment, despite the rising US Dollar. (Pivot Orderbook analysis)
…
This is a premium post.
[s2If !current_user_can(access_s2member_level4)]Please register for PREMIUM VERSION HERE to read full post below containing analysis. In case of any error or you think you are not able to read the full post below, please email us at support#nehcap.com [lwa][/s2If] [s2If current_user_can(access_s2member_level4)]
- XAG/USD surpasses monthly highs amid positive market sentiment, despite the rising US Dollar.
- US Core PCE was below estimates, opening the door for a less aggressive Fed.
- XAG/USD Price Analysis: Expected to continue its rally and test the YTD high of $24.63
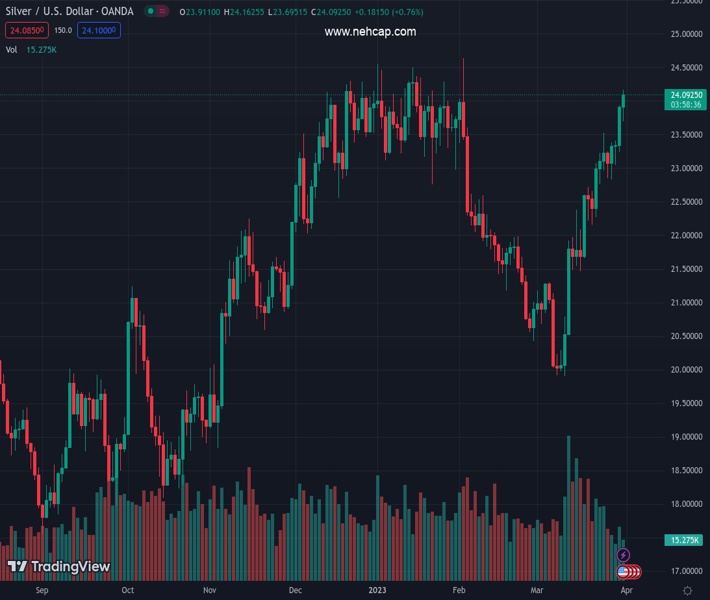
The pair currently trades last at 24.094.
The previous day high was 23.93 while the previous day low was 23.24. The daily 38.2% Fib levels comes at 23.67, expected to provide support. Similarly, the daily 61.8% fib level is at 23.5, expected to provide support.
Silver price trades at new monthly highs above $24.00 a troy ounce, sponsored by falling US Treasury bond yields. Sentiment continues to be the main driver in the session, with US equities set to finish the month with gains. At the time of writing, the XAG/USD is trading at $24.10, gaining 0.89%.
Wall Street continues to print gains across the board. The greenback is pressured by data from the United States (US), which showed inflation tempering; therefore, less aggression by the US Federal Reserve (Fed) is needed.
The Department of Commerce (DoC) featured the Fed’s preferred gauge for inflation, the Core Personal Consumption Expenditure (PCE) for February, which rose by 4.6% YoY, below estimates of 4.7%, while the headline inflation dropped from 5.3% to 5% YoY.
Consequently, US Treasury bond yields edged lower, a tailwind for the white metal, which pushed through the $24.00 threshold for the first time since February 2. The US 10-year Treasury bond yield dropped four basis points (bps) at 3.516%, while US Real Yields stood at 1.26% as of March 30.
In the meantime, the University of Michigan (UoM) Consumer Sentiment for March was lower than expected, at 62, as opposed to the foreseen 67. Moreover, the survey updated that American consumers revised their inflation expectations downward. For the one-year horizon, the estimated inflation rate is 3.6%, while for the 5-year horizon, consumers estimate inflation to be 2.9%.
On the central bank side, Boston Fed’s President Susan Collins said that PCE inflation data is positive news, yet there’s still more work to do to bring inflation towards the 2% target.
Given the backdrop, the XAG/USD is set to extend its rally and test the YTD high at $24.63. The Relative Strength Index (RSI), albeit at overbought conditions, backed the uptrend, while the Rate of Change (RoC) portrays buyers piled around the $22.00 area. The XAG/USD might consolidate as the RSI exits from overbought conditions, as buyers prepare to assault $25.00. if the XAG/USD clears $24.63, the psychological $25.00 barrier would be exposed. Once cleared, on April 18, 2022, resistance at $26.21 is next.
Technical Levels: Supports and Resistances
XAGUSD currently trading at 24.11 at the time of writing. Pair opened at 23.92 and is trading with a change of 0.79 % .
| Overview | Overview.1 | |
|---|---|---|
| 0 | Today last price | 24.11 |
| 1 | Today Daily Change | 0.19 |
| 2 | Today Daily Change % | 0.79 |
| 3 | Today daily open | 23.92 |
The pair remains strongly bullish on the daily timeframe. It trades above its 20 SMA @ 22.03, 50 SMA 22.21, 100 SMA @ 22.57 and 200 SMA @ 21.02.
| Trends | Trends.1 | |
|---|---|---|
| 0 | Daily SMA20 | 22.03 |
| 1 | Daily SMA50 | 22.21 |
| 2 | Daily SMA100 | 22.57 |
| 3 | Daily SMA200 | 21.02 |
The previous day high was 23.93 while the previous day low was 23.24. The daily 38.2% Fib levels comes at 23.67, expected to provide support. Similarly, the daily 61.8% fib level is at 23.5, expected to provide support.
Note the levels of interest below:
- Pivot support is noted at 23.46, 23.0, 22.76
- Pivot resistance is noted at 24.15, 24.39, 24.85
| Levels | Levels.1 |
|---|---|
| Previous Daily High | 23.93 |
| Previous Daily Low | 23.24 |
| Previous Weekly High | 23.52 |
| Previous Weekly Low | 22.16 |
| Previous Monthly High | 24.64 |
| Previous Monthly Low | 20.42 |
| Daily Fibonacci 38.2% | 23.67 |
| Daily Fibonacci 61.8% | 23.50 |
| Daily Pivot Point S1 | 23.46 |
| Daily Pivot Point S2 | 23.00 |
| Daily Pivot Point S3 | 22.76 |
| Daily Pivot Point R1 | 24.15 |
| Daily Pivot Point R2 | 24.39 |
| Daily Pivot Point R3 | 24.85 |
[/s2If]
Join Our Telegram Group
")


