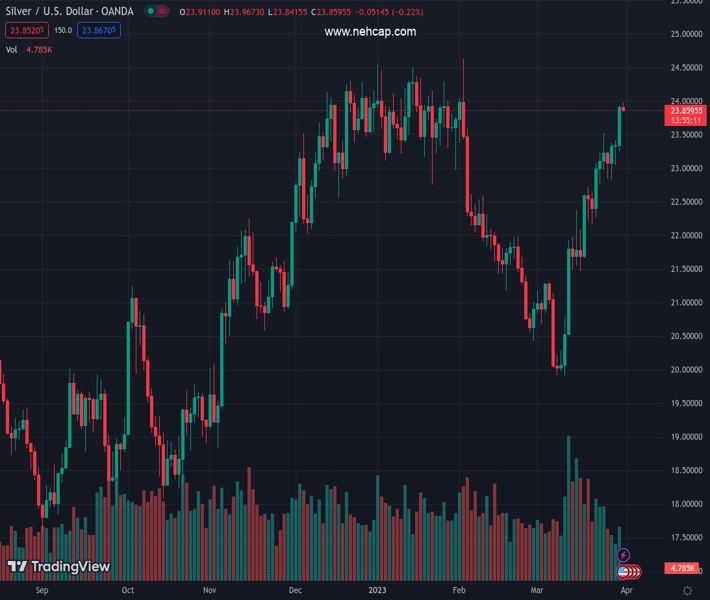
#XAGUSD @ 23.862 Silver price retreats from two-month high, snaps three-day winning streak., @nehcap view: Limited downside expected (Pivot Orderbook analysis)
…
This is a premium post.
[s2If !current_user_can(access_s2member_level4)]Please register for PREMIUM VERSION HERE to read full post below containing analysis. In case of any error or you think you are not able to read the full post below, please email us at support#nehcap.com [lwa][/s2If] [s2If current_user_can(access_s2member_level4)]
- Silver price retreats from two-month high, snaps three-day winning streak.
- Fortnight-old bullish channel restricts immediate downside ahead of the key SMAs.
- Overbought RSI suggests further pullback in XAG/USD price but bears are far from sight.
The pair currently trades last at 23.862.
The previous day high was 23.93 while the previous day low was 23.24. The daily 38.2% Fib levels comes at 23.67, expected to provide support. Similarly, the daily 61.8% fib level is at 23.5, expected to provide support.
Silver price (XAG/USD) pares weekly gains at the highest levels in two months, mildly offered near $23.85 heading into Friday’s European session. In doing so, the bright metal prints the first daily loss in four ahead of the key inflation data from Eurozone and the US.
Also read: Gold Price Forecast: Inflation data, $1,973 support to restrain XAU/USD bears – Confluence Detector
The precious metal’s latest weakness could be linked to a pullback from the resistance line of a two-week-old bullish channel. The XAG/USD retreat also justifies the overbought RSI (14).
However, bullish MACD signals and the stated channel formation keep the Silver bears off the table unless the quote breaks the $23.30 mark, comprising the stated channel’s lower line.
Even so, the 100-SMA and 200-SMA can challenge the bullion’s additional downside near $22.30 and $21.70.
Should the Silver price remains bearish past $21.70, the odds of witnessing a slump toward the $20.00 round figure and then to the monthly low of $19.90 can’t be ruled out.
On the flip side, XAG/USD recovery needs to cross the immediate channel’s top line, close to $24.05 at the latest.
However, the yearly high marked in February around $24.65 can challenge the Silver buyers before giving back control to them.
Trend: Limited downside expected
Technical Levels: Supports and Resistances
XAGUSD currently trading at 23.85 at the time of writing. Pair opened at 23.92 and is trading with a change of -0.29 % .
| Overview | Overview.1 | |
|---|---|---|
| 0 | Today last price | 23.85 |
| 1 | Today Daily Change | -0.07 |
| 2 | Today Daily Change % | -0.29 |
| 3 | Today daily open | 23.92 |
The pair remains strongly bullish on the daily timeframe. It trades above its 20 SMA @ 22.03, 50 SMA 22.21, 100 SMA @ 22.57 and 200 SMA @ 21.02.
| Trends | Trends.1 | |
|---|---|---|
| 0 | Daily SMA20 | 22.03 |
| 1 | Daily SMA50 | 22.21 |
| 2 | Daily SMA100 | 22.57 |
| 3 | Daily SMA200 | 21.02 |
The previous day high was 23.93 while the previous day low was 23.24. The daily 38.2% Fib levels comes at 23.67, expected to provide support. Similarly, the daily 61.8% fib level is at 23.5, expected to provide support.
Note the levels of interest below:
- Pivot support is noted at 23.46, 23.0, 22.76
- Pivot resistance is noted at 24.15, 24.39, 24.85
| Levels | Levels.1 |
|---|---|
| Previous Daily High | 23.93 |
| Previous Daily Low | 23.24 |
| Previous Weekly High | 23.52 |
| Previous Weekly Low | 22.16 |
| Previous Monthly High | 24.64 |
| Previous Monthly Low | 20.42 |
| Daily Fibonacci 38.2% | 23.67 |
| Daily Fibonacci 61.8% | 23.50 |
| Daily Pivot Point S1 | 23.46 |
| Daily Pivot Point S2 | 23.00 |
| Daily Pivot Point S3 | 22.76 |
| Daily Pivot Point R1 | 24.15 |
| Daily Pivot Point R2 | 24.39 |
| Daily Pivot Point R3 | 24.85 |
[/s2If]
Join Our Telegram Group
")


