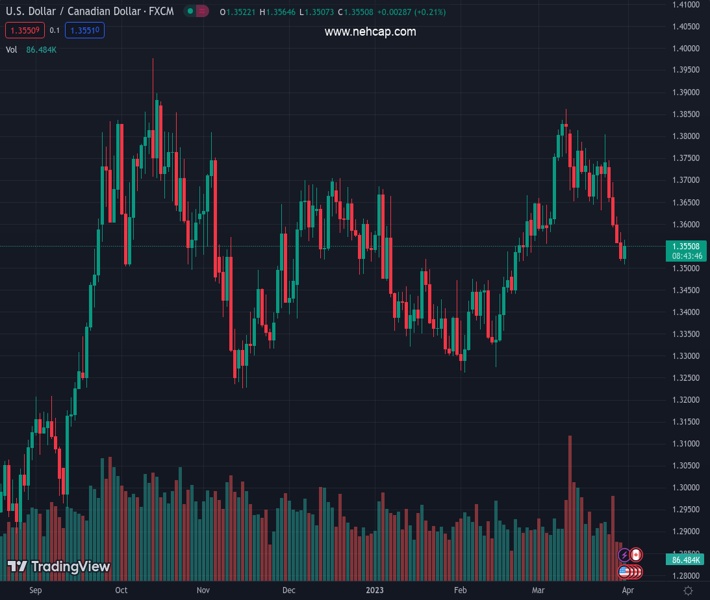
#USDCAD @ 1.35473 stages a goodish rebound from a multi-week low amid a pickup in the USD demand. (Pivot Orderbook analysis)
…
This is a premium post.
[s2If !current_user_can(access_s2member_level4)]Please register for PREMIUM VERSION HERE to read full post below containing analysis. In case of any error or you think you are not able to read the full post below, please email us at support#nehcap.com [lwa][/s2If] [s2If current_user_can(access_s2member_level4)]
- USD/CAD stages a goodish rebound from a multi-week low amid a pickup in the USD demand.
- Bullish Crude Oil prices underpin the Loonie and act as a headwind amid a positive risk tone.
- Traders also seem reluctant to place bets ahead of the Canadian GDP and the US PCE inflation.
The pair currently trades last at 1.35473.
The previous day high was 1.3581 while the previous day low was 1.3516. The daily 38.2% Fib levels comes at 1.3541, expected to provide support. Similarly, the daily 61.8% fib level is at 1.3556, expected to provide resistance.
The USD/CAD pair shows resilience below the 100-day Simple Moving Average (SMA) and attracts some buying in the vicinity of the 1.3500 psychological mark, or a five-and-half-week low touched earlier Friday. The pair maintains its bid tone heading into the North American session and is currently placed around the 1.3550 area, just a few pips below the daily high.
The US Dollar (USD) regains some positive traction on the last day of the week and is seen as a key factor acting as a tailwind for the USD/CAD pair. That said, the prevalent risk-on mood keeps a lid on any meaningful upside for the safe-haven Greenback. Apart from this, the recent uptrend in Crude Oil prices, to a nearly three-week high, lends some support to the commodity-linked Loonie and contributes to capping gains for the major.
Traders also seem reluctant to place aggressive bets ahead of the release of the monthly Canadian GDP and the US Core PCE Price Index, the Fed’s preferred inflation gauge. The USD/CAD pair, for now, seems to have stalled its intraday positive move near the 50% Fibonacci retracement level of the February-March rally. A sustained move beyond could lift spot prices beyond the 1.3600 mark, towards the 1.3640 region, or the 61.8% Fibo. level.
Some follow-through buying beyond mid-1.3600s will negate any near-term bearish bias and pave the way for a move towards the 1.3700 round figure en route to the 1.3720 zone, or the 23.6% Fibo. level.
On the flip side, the 1.3500 mark represents 61.8% Fibo. level and should now act as a pivotal point, which if broken will be seen as a fresh trigger for bearish traders. The USD/CAD pair might then turn vulnerable to accelerate the fall towards intermediate support near the 1.3455-1.3450 horizontal zone. Spot prices could eventually drop to the 1.3400 round figure en route to the next relevant support near the 1.3330-1.3325 region.
Technical Levels: Supports and Resistances
USDCAD currently trading at 1.3549 at the time of writing. Pair opened at 1.3523 and is trading with a change of 0.19 % .
| Overview | Overview.1 | |
|---|---|---|
| 0 | Today last price | 1.3549 |
| 1 | Today Daily Change | 0.0026 |
| 2 | Today Daily Change % | 0.1900 |
| 3 | Today daily open | 1.3523 |
The pair is trading below its 20 Daily moving average @ 1.3698, above its 50 Daily moving average @ 1.354 , above its 100 Daily moving average @ 1.3519 and above its 200 Daily moving average @ 1.3372
| Trends | Trends.1 | |
|---|---|---|
| 0 | Daily SMA20 | 1.3698 |
| 1 | Daily SMA50 | 1.3540 |
| 2 | Daily SMA100 | 1.3519 |
| 3 | Daily SMA200 | 1.3372 |
The previous day high was 1.3581 while the previous day low was 1.3516. The daily 38.2% Fib levels comes at 1.3541, expected to provide support. Similarly, the daily 61.8% fib level is at 1.3556, expected to provide resistance.
Note the levels of interest below:
- Pivot support is noted at 1.3499, 1.3474, 1.3433
- Pivot resistance is noted at 1.3564, 1.3605, 1.363
| Levels | Levels.1 |
|---|---|
| Previous Daily High | 1.3581 |
| Previous Daily Low | 1.3516 |
| Previous Weekly High | 1.3804 |
| Previous Weekly Low | 1.3631 |
| Previous Monthly High | 1.3666 |
| Previous Monthly Low | 1.3262 |
| Daily Fibonacci 38.2% | 1.3541 |
| Daily Fibonacci 61.8% | 1.3556 |
| Daily Pivot Point S1 | 1.3499 |
| Daily Pivot Point S2 | 1.3474 |
| Daily Pivot Point S3 | 1.3433 |
| Daily Pivot Point R1 | 1.3564 |
| Daily Pivot Point R2 | 1.3605 |
| Daily Pivot Point R3 | 1.3630 |
[/s2If]
Join Our Telegram Group
")


