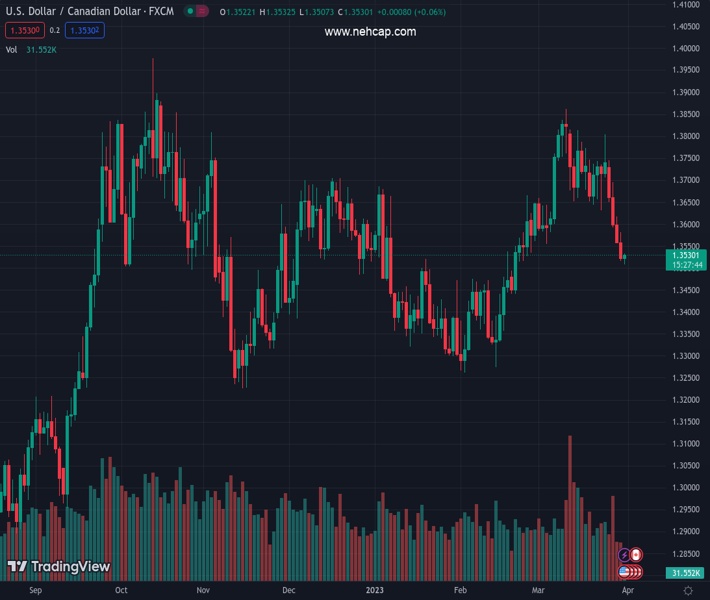
#USDCAD @ 1.35307 picks up bids to pare intraday losses around five-week low. (Pivot Orderbook analysis)
…
This is a premium post.
[s2If !current_user_can(access_s2member_level4)]Please register for PREMIUM VERSION HERE to read full post below containing analysis. In case of any error or you think you are not able to read the full post below, please email us at support#nehcap.com [lwa][/s2If] [s2If current_user_can(access_s2member_level4)]
- USD/CAD picks up bids to pare intraday losses around five-week low.
- Oil traders struggle to cheer risk-on mood, upbeat China PMI as US Dollar pauses downside.
- Recently falling hawkish Fed bets, mixed US data allow Loonie bears to remain hopeful.
- Canada GDP for January, US Core PCE Price Index eyed for fresh impulse.
The pair currently trades last at 1.35307.
The previous day high was 1.3581 while the previous day low was 1.3516. The daily 38.2% Fib levels comes at 1.3541, expected to provide resistance. Similarly, the daily 61.8% fib level is at 1.3556, expected to provide resistance.
USD/CAD licks its wounds around 1.3520 as it pares the weekly losses around the lowest levels in more than a month, after refreshing the multi-day low, during early Friday. In doing so, the Loonie pair takes clues from the inactive Oil price and the US Dollar amid the market’s cautious mood ahead of the key inflation data from the US, as well as Canada’s Monthly Gross Domestic Product (GDP) data for January.
WTI crude oil remains mildly offered around $74.30 after refreshing a 13-day high earlier in the day. That said, upbeat prints of China’s official PMIs for March join talks of no change in the production policies of the Organization of the Petroleum Exporting Countries (OPEC) and allies led by Russia, known collectively as OPEC+, to favor the Oil buyers.
On the other hand, the US Dollar Index (DXY) seesaws around 102.25, after refreshing the weekly bottom with 102.05 earlier in the day. In doing so, the greenback’s gauge versus the six major currencies portrays the pre-data anxiety, while also taking clues from the lackluster markets, to prod the DXY traders.
It should be noted that the recent hawkish rhetoric of the Fed officials and strong US inflation expectations seemed to have triggered the USD/CAD pair’s corrective bounce. That said, Fed Jerome Powell joined Boston Fed President Susan Collins, Minneapolis Fed Leader Neel Kashkari and Richmond Fed President Thomas Barkin to suggest the US central bank’s further rate hike to tame the inflation woes. However, mixed US data raise doubts about the Fed policymakers’ hawkish rhetoric and rather concentrated on their rejection of banking crisis woes to weigh on the US Dollar, as well the Fed bets.
As per the latest reading of the CME’s FedWatch Tool, traders place a nearly 47% chance of a 0.25% rate hike in the May month Federal Open Market Committee (FOMC) Monetary policy meeting, versus 60% the previous day.
Amid these plays, the S&P 500 Futures refresh a three-week high by tracing Wall Street’s upbeat sentiment. Though, the US 10-year Treasury bond yields rose two basis points (bps) to 3.57% whereas the two-year counterpart grinds higher to 4.13% during a five-day uptrend.
Looking ahead, USD/CAD may defend the latest corrective bounce ahead of the key US inflation clues, as well as Canadian GDP. However, the actual prints of the Core Personal Consumption Expenditure (PCE) Price Index for February will be crucial for clear directions.
The 100-DMA challenges USD/CAD bears around 1.3520 ahead of directing them to the key support line stretched from June 2022, close to 1.3480. That said, the bearish MACD signals and sustained trading below the 50-DMA, close to 1.3545 at the latest, suggest the Loonie pair’s further downside.
Technical Levels: Supports and Resistances
USDCAD currently trading at 1.3528 at the time of writing. Pair opened at 1.3523 and is trading with a change of 0.04% % .
| Overview | Overview.1 | |
|---|---|---|
| 0 | Today last price | 1.3528 |
| 1 | Today Daily Change | 0.0005 |
| 2 | Today Daily Change % | 0.04% |
| 3 | Today daily open | 1.3523 |
The pair is trading below its 20 Daily moving average @ 1.3698, below its 50 Daily moving average @ 1.354 , above its 100 Daily moving average @ 1.3519 and above its 200 Daily moving average @ 1.3372
| Trends | Trends.1 | |
|---|---|---|
| 0 | Daily SMA20 | 1.3698 |
| 1 | Daily SMA50 | 1.3540 |
| 2 | Daily SMA100 | 1.3519 |
| 3 | Daily SMA200 | 1.3372 |
The previous day high was 1.3581 while the previous day low was 1.3516. The daily 38.2% Fib levels comes at 1.3541, expected to provide resistance. Similarly, the daily 61.8% fib level is at 1.3556, expected to provide resistance.
Note the levels of interest below:
- Pivot support is noted at 1.3499, 1.3474, 1.3433
- Pivot resistance is noted at 1.3564, 1.3605, 1.363
| Levels | Levels.1 |
|---|---|
| Previous Daily High | 1.3581 |
| Previous Daily Low | 1.3516 |
| Previous Weekly High | 1.3804 |
| Previous Weekly Low | 1.3631 |
| Previous Monthly High | 1.3666 |
| Previous Monthly Low | 1.3262 |
| Daily Fibonacci 38.2% | 1.3541 |
| Daily Fibonacci 61.8% | 1.3556 |
| Daily Pivot Point S1 | 1.3499 |
| Daily Pivot Point S2 | 1.3474 |
| Daily Pivot Point S3 | 1.3433 |
| Daily Pivot Point R1 | 1.3564 |
| Daily Pivot Point R2 | 1.3605 |
| Daily Pivot Point R3 | 1.3630 |
[/s2If]
Join Our Telegram Group
")


