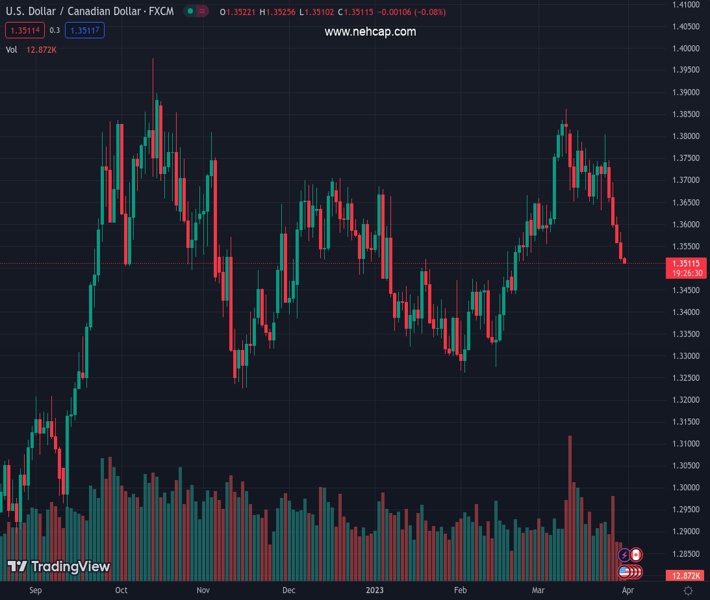
#USDCAD @ 1.35130 seesaws around five-week low after four-day downtrend., @nehcap view: Further downside expected (Pivot Orderbook analysis)
…
This is a premium post.
[s2If !current_user_can(access_s2member_level4)]Please register for PREMIUM VERSION HERE to read full post below containing analysis. In case of any error or you think you are not able to read the full post below, please email us at support#nehcap.com [lwa][/s2If] [s2If current_user_can(access_s2member_level4)]
- USD/CAD seesaws around five-week low after four-day downtrend.
- Clear break of 50-DMA, downbeat oscillators keep sellers hopeful.
- Ascending support line from June 2022 appears the key challenge for Loonie bears.
- Buyers have a bumpy road on the way to retake control.
The pair currently trades last at 1.35130.
The previous day high was 1.3581 while the previous day low was 1.3516. The daily 38.2% Fib levels comes at 1.3541, expected to provide resistance. Similarly, the daily 61.8% fib level is at 1.3556, expected to provide resistance.
USD/CAD sellers flirt with 1.3520-25, after declining to the lowest levels since February 22, as markets turn dicey on Friday ahead of the key inflation data from the US. In doing so, the Loonie pair prints minor losses during the five-day losing streak.
Even so, the pair’s successful downside break of the 50-DMA joins bears MACD signals to keep the sellers hopeful. Adding strength to the bearish bias is the absence of the oversold RSI (14) line.
It’s worth noting, however, that an upward-sloping support line from early June 2022, close to 1.3475 by the press time, appears a tough nut to crack for the USD/CAD bears to watch during the further downside. Also highlighting the importance of the 1.3475 level is the RSI’s fall below the 50 level as it suggests the likely dip-buying around the key support line.
In a case where the Loonie pair breaks the 1.3475 support, the 200-DMA and an ascending trend line from mid-November 2022, respectively near 1.3375 and 1.3295, could challenge the bears afterward.
On the contrary, recovery moves need validation from the 50-DMA resistance of 1.3545 to convince short-term USD/CAD buyers.
However, the mid-month low around 1.3650-55 and December 2022 tops surrounding 1.3705 can challenge the Loonie pair’s further upside before highlighting the previous yearly top of 1.3977.
Trend: Further downside expected
Technical Levels: Supports and Resistances
USDCAD currently trading at 1.3519 at the time of writing. Pair opened at 1.3523 and is trading with a change of -0.03% % .
| Overview | Overview.1 | |
|---|---|---|
| 0 | Today last price | 1.3519 |
| 1 | Today Daily Change | -0.0004 |
| 2 | Today Daily Change % | -0.03% |
| 3 | Today daily open | 1.3523 |
The pair is trading below its 20 Daily moving average @ 1.3698, below its 50 Daily moving average @ 1.354 , below its 100 Daily moving average @ 1.3519 and above its 200 Daily moving average @ 1.3372
| Trends | Trends.1 | |
|---|---|---|
| 0 | Daily SMA20 | 1.3698 |
| 1 | Daily SMA50 | 1.3540 |
| 2 | Daily SMA100 | 1.3519 |
| 3 | Daily SMA200 | 1.3372 |
The previous day high was 1.3581 while the previous day low was 1.3516. The daily 38.2% Fib levels comes at 1.3541, expected to provide resistance. Similarly, the daily 61.8% fib level is at 1.3556, expected to provide resistance.
Note the levels of interest below:
- Pivot support is noted at 1.3499, 1.3474, 1.3433
- Pivot resistance is noted at 1.3564, 1.3605, 1.363
| Levels | Levels.1 |
|---|---|
| Previous Daily High | 1.3581 |
| Previous Daily Low | 1.3516 |
| Previous Weekly High | 1.3804 |
| Previous Weekly Low | 1.3631 |
| Previous Monthly High | 1.3666 |
| Previous Monthly Low | 1.3262 |
| Daily Fibonacci 38.2% | 1.3541 |
| Daily Fibonacci 61.8% | 1.3556 |
| Daily Pivot Point S1 | 1.3499 |
| Daily Pivot Point S2 | 1.3474 |
| Daily Pivot Point S3 | 1.3433 |
| Daily Pivot Point R1 | 1.3564 |
| Daily Pivot Point R2 | 1.3605 |
| Daily Pivot Point R3 | 1.3630 |
[/s2If]
Join Our Telegram Group
")


