US Department of Commerce reported that PCE was below estimates, spurring speculations for a Fed shift. (Pivot Orderbook analysis)
…
This is a premium post.
[s2If !current_user_can(access_s2member_level4)]Please register for PREMIUM VERSION HERE to read full post below containing analysis. In case of any error or you think you are not able to read the full post below, please email us at support#nehcap.com [lwa][/s2If] [s2If current_user_can(access_s2member_level4)]
- US Department of Commerce reported that PCE was below estimates, spurring speculations for a Fed shift.
- Oil prices rise after output reduction at several oilfields in northern Iraq’s Kurdistan region.
The pair currently trades last at 75.76.
The previous day high was 74.66 while the previous day low was 72.69. The daily 38.2% Fib levels comes at 73.91, expected to provide support. Similarly, the daily 61.8% fib level is at 73.44, expected to provide support.
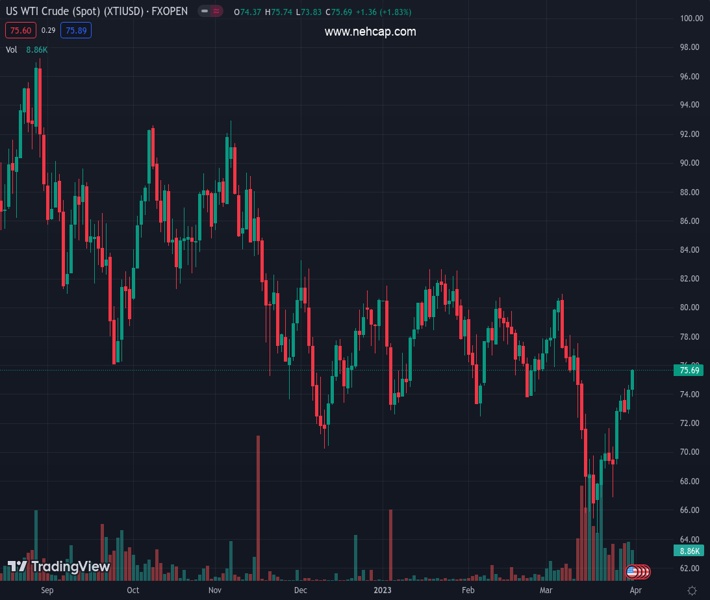
Western Texas Intermediate (WT), the US crude oil benchmark, is set to finish the week with more than 9% gains after touching a YTD low of $64.41. On Friday, WTI is trading at $75.60 PB, above its opening price by 1.74%.
Wall Street finished the week with substantial gains. Inflation data in the United States (US) reported by the Department of Commerce showed that Personal Consumption Expenditure (PCE) Index rose below estimates. Headline inflation came at 5% YoY, below forecasts of 5.3%, and core PCE was 4.6% YoY, below estimates.
Hence, the odds that the US Federal Reserve (Fed) could pause tightening its policy increased. The CME FedWatch Tool shows that the odds for a pause lie at 49.6%. The latest round of inflation data pointing down improved investors’ mood, meaning that less aggressive rate hikes could keep the US Dollar in check.
Oil prices jumped since the halt of Kurdistan oil export through Turkey at the beginning of the week. The total amount of oil shortage was 450K BPD.
In the meantime, according to Reuters sources, the Organization of Petroleum Export Countries (OPEC) agreed to stick to its crude output production at a meeting on Monday.
According to a survey conducted by Reuters, OPEC’s crude oil production for the current month is estimated at 28.90 million barrels per day BPD, which is a decrease of 70K BPD compared to February. Moreover, the current output is more than 700K BPD lower than what was recorded in September.
Technical Levels: Supports and Resistances
XTIUSD currently trading at 75.76 at the time of writing. Pair opened at 74.41 and is trading with a change of 1.81 % .
| Overview | Overview.1 | |
|---|---|---|
| 0 | Today last price | 75.76 |
| 1 | Today Daily Change | 1.35 |
| 2 | Today Daily Change % | 1.81 |
| 3 | Today daily open | 74.41 |
The pair is trading above its 20 Daily moving average @ 72.83, below its 50 Daily moving average @ 75.89 , below its 100 Daily moving average @ 77.07 and below its 200 Daily moving average @ 83.79
| Trends | Trends.1 | |
|---|---|---|
| 0 | Daily SMA20 | 72.83 |
| 1 | Daily SMA50 | 75.89 |
| 2 | Daily SMA100 | 77.07 |
| 3 | Daily SMA200 | 83.79 |
The previous day high was 74.66 while the previous day low was 72.69. The daily 38.2% Fib levels comes at 73.91, expected to provide support. Similarly, the daily 61.8% fib level is at 73.44, expected to provide support.
Note the levels of interest below:
- Pivot support is noted at 73.18, 71.95, 71.21
- Pivot resistance is noted at 75.15, 75.89, 77.12
| Levels | Levels.1 |
|---|---|
| Previous Daily High | 74.66 |
| Previous Daily Low | 72.69 |
| Previous Weekly High | 71.69 |
| Previous Weekly Low | 64.39 |
| Previous Monthly High | 80.75 |
| Previous Monthly Low | 72.50 |
| Daily Fibonacci 38.2% | 73.91 |
| Daily Fibonacci 61.8% | 73.44 |
| Daily Pivot Point S1 | 73.18 |
| Daily Pivot Point S2 | 71.95 |
| Daily Pivot Point S3 | 71.21 |
| Daily Pivot Point R1 | 75.15 |
| Daily Pivot Point R2 | 75.89 |
| Daily Pivot Point R3 | 77.12 |
[/s2If]
Join Our Telegram Group
")


