#EURUSD @ 1.09119 seesaws around weekly high after rising the most in one-week the previous day., @nehcap view: Limited upside expected (Pivot Orderbook analysis)
…
This is a premium post.
[s2If !current_user_can(access_s2member_level4)]Please register for PREMIUM VERSION HERE to read full post below containing analysis. In case of any error or you think you are not able to read the full post below, please email us at support#nehcap.com [lwa][/s2If] [s2If current_user_can(access_s2member_level4)]
- EUR/USD seesaws around weekly high after rising the most in one-week the previous day.
- Upbeat sentiment, softer yields supersede hawkish Fed talks to propel the Euro pair.
- 10-week-old horizontal resistance area can challenge bulls are RSI turns overbought.
- Sellers need 50-SMA breakdown to retake control; January’s top can lure bulls past 1.0930 hurdle.
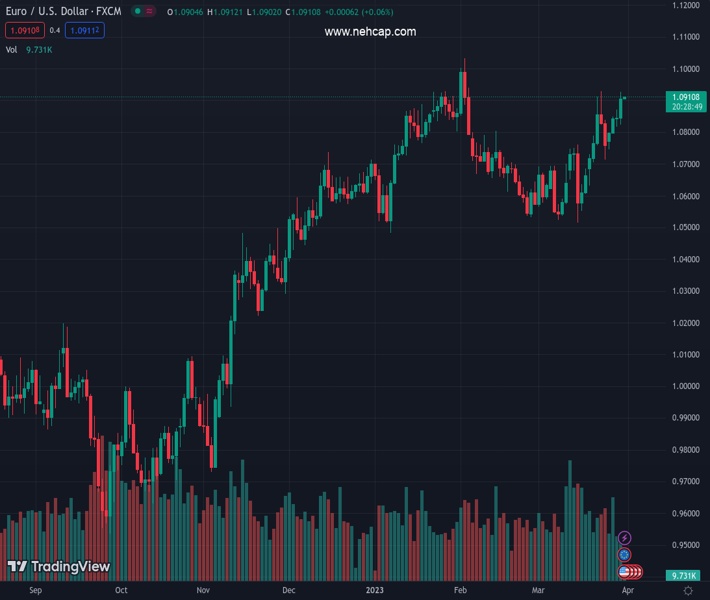
The pair currently trades last at 1.09119.
The previous day high was 1.0926 while the previous day low was 1.0824. The daily 38.2% Fib levels comes at 1.0887, expected to provide support. Similarly, the daily 61.8% fib level is at 1.0863, expected to provide support.
EUR/USD depicts the market’s pre-inflation anxiety while making rounds to 1.0900, after refreshing a one-week high, during early Friday. In doing so, the Euro pair portrays another battle with the key horizontal resistance established on January 23.
Given the overbought RSI (14) and the Euro pair’s repeated failures to cross the 1.0930-35 horizontal resistance area, the pair buyers are likely to witness one more disappointment should the Eurozone inflation data ease and/or US Core PCE Price Index softens.
Also read: EUR/USD Forecast: Positive signs for the Euro ahead of more inflation data
In a case where the EUR/USD bulls ignore the RSI (14) conditions, backed by fundamental support, and cross the 1.0935 hurdle, the odds of witnessing a rally towards the yearly top marked in January near 1.1035 can’t be ruled out.
Meanwhile, a two-week-old ascending support line, close to 1.0850 at the latest, restricts the short-term EUR/USD downside.
Following that, the 50-SMA level surrounding 1.0820 and the mid-March high near 1.0750 can act as the last defenses of the EUR/USD buyers, a break of which could quickly drag the quote towards the monthly low of near 1.0515.
Overall, the EUR/USD pair remains on the bull’s radar unless breaking the 1.0750 level but the limited upside room highlights today’s inflation numbers as the key catalysts.
Trend: Limited upside expected
Technical Levels: Supports and Resistances
EURUSD currently trading at 1.0906 at the time of writing. Pair opened at 1.0905 and is trading with a change of 0.01% % .
| Overview | Overview.1 | |
|---|---|---|
| 0 | Today last price | 1.0906 |
| 1 | Today Daily Change | 0.0001 |
| 2 | Today Daily Change % | 0.01% |
| 3 | Today daily open | 1.0905 |
The pair remains strongly bullish on the daily timeframe. It trades above its 20 SMA @ 1.0714, 50 SMA 1.0732, 100 SMA @ 1.0646 and 200 SMA @ 1.034.
| Trends | Trends.1 | |
|---|---|---|
| 0 | Daily SMA20 | 1.0714 |
| 1 | Daily SMA50 | 1.0732 |
| 2 | Daily SMA100 | 1.0646 |
| 3 | Daily SMA200 | 1.0340 |
The previous day high was 1.0926 while the previous day low was 1.0824. The daily 38.2% Fib levels comes at 1.0887, expected to provide support. Similarly, the daily 61.8% fib level is at 1.0863, expected to provide support.
Note the levels of interest below:
- Pivot support is noted at 1.0844, 1.0782, 1.0741
- Pivot resistance is noted at 1.0947, 1.0988, 1.105
| Levels | Levels.1 |
|---|---|
| Previous Daily High | 1.0926 |
| Previous Daily Low | 1.0824 |
| Previous Weekly High | 1.0930 |
| Previous Weekly Low | 1.0631 |
| Previous Monthly High | 1.1033 |
| Previous Monthly Low | 1.0533 |
| Daily Fibonacci 38.2% | 1.0887 |
| Daily Fibonacci 61.8% | 1.0863 |
| Daily Pivot Point S1 | 1.0844 |
| Daily Pivot Point S2 | 1.0782 |
| Daily Pivot Point S3 | 1.0741 |
| Daily Pivot Point R1 | 1.0947 |
| Daily Pivot Point R2 | 1.0988 |
| Daily Pivot Point R3 | 1.1050 |
[/s2If]
Join Our Telegram Group
")


