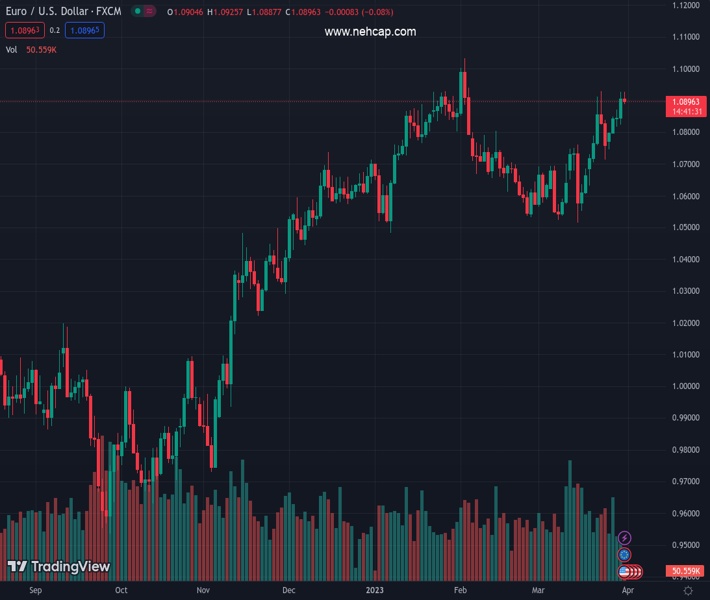
#EURUSD @ 1.08959 has corrected to near 1.0900 as investors have turned anxious ahead of Eurozone HICP and US PCE Price Index. (Pivot Orderbook analysis)
…
This is a premium post.
[s2If !current_user_can(access_s2member_level4)]Please register for PREMIUM VERSION HERE to read full post below containing analysis. In case of any error or you think you are not able to read the full post below, please email us at support#nehcap.com [lwa][/s2If] [s2If current_user_can(access_s2member_level4)]
- EUR/USD has corrected to near 1.0900 as investors have turned anxious ahead of Eurozone HICP and US PCE Price Index.
- Federal Reserve policymakers have continued favoring rate-hiking spell to tame persistent US inflation.
- European Central Bank would announce more rate hikes as Eurozone inflation is expected to remain persistent due to a shortage of labor.
- EUR/USD has formed a Double Top pattern but needs to clear more filters for validation.
The pair currently trades last at 1.08959.
The previous day high was 1.0926 while the previous day low was 1.0824. The daily 38.2% Fib levels comes at 1.0887, expected to provide support. Similarly, the daily 61.8% fib level is at 1.0863, expected to provide support.
EUR/USD has corrected gradually to near 1.0900 after failing to surpass Thursday’s high around 1.0926 in the early European session. The major currency pair has sensed selling pressure as investors have turned cautious ahead of the release of the Eurozone preliminary Harmonized Index of Consumer Prices (HICP) and United States core Personal Consumption Expenditure (PCE) Price Index data.
The US Dollar Index (DXY) has shown signs of recovery, building a cushion above 102.10. The downside bets for the USD Index have been trimmed as investors are anticipating a rate hike in May monetary policy meeting by the Federal Reserve (Fed). The approach for May policy has changed swiftly as waning fears of further casualty in the US banking system have opened room for the continuation of a policy-tightening spell by the Federal Reserve.
Meanwhile, gains generated by the S&P500 futures in the Asian session are halved now as investors are getting anxious ahead of the release of the Federal Reserve’s preferred inflation tool. However, the overall market mood is quite bullish. The demand for US government bonds has turned subdued as investors are shrugging off the US banking collapse event. The 10-year US Treasury yields are choppy around 3.55%.
Ebbing fears of further US banking turmoil have infused enormous confidence among market participants. Investors are not anticipating any recession warnings amid waning baking jitters, which has supported demand for US equities. Fading banking jitters have also restored confidence among Federal Reserve policymakers that the hiking spell can be continued to tame persistent US inflation. In a private meeting with US lawmakers, Federal Reserve chair Jerome Powell cited that he anticipates one more rate hike in 2023. As per the CME Fedwatch tool, chances of a 25 basis points (bp) rate hike have scaled above 53%, which will push rates to 5.00-5.25%.
Adding to that, Richmond Federal Reserve President Thomas Barkin said on Thursday that he is content with the current trajectory set by the FOMC of evaluating whether a 25 bps interest rate hike is required at each meeting. According to Barkin, there is a lot of money available for spending among households. He further added, “It is possible that tightening credit conditions, along with the lagged effect of our rate moves, will bring inflation down relatively quickly. But I still think it could take time for inflation to return to target.”
For further clarity, investors will keep an eye on US core PCE Price Index data. Analysts at Wells Fargo have forecasted the PCE deflator (+0.4%) to outpace nominal spending (+0.3%).
Considering cues from the German HICP released on Thursday, it is highly likely that Eurozone headline inflation would soften dramatically led by lower energy prices. As per the consensus, the Eurozone headline HICP is expected to soften to 7.1% from the former release of 8.5%. The economic indicator that could propel the need of more rate hikes from the European Central Bank (ECB) is the extreme shortage of labor in the Eurozone.
Bargaining power has shifted to talent due to a shortage of job seekers, which also allowed wage growth to scale higher. The Labor cost index in Eurozone is shuffling between 5% and 6%, the highest in decades, as reported by Reuters.
Therefore, core Eurozone Inflation data could turn sticky further as households are equipped with sufficient funds for disposal. The street is anticipating that European Central Bank President Christine Lagarde will hike rates further ahead.
EUR/USD is forming a Double Top chart pattern near 1.0926 on an hourly scale, which indicates an absence of sheer buying interest while surpassing previous highs. The Double Top chart pattern has not been triggered yet as the asset is continued with higher highs and higher lows structure. This could be a corrective move after a perpendicular rally by the Euro. The critical support is plotted around 1.0890 whose breakdown could activate the Double Top formation.
Upward-sloping 20-period Exponential Moving Average (EMA) at 1.0890 is providing a cushion to the Euro.
Meanwhile, the Relative Strength Index (RSI) (14) has slipped into the 40.00-60.00 range from the bullish range of 60.00-80.00, which indicates a loss in the upside momentum.
Technical Levels: Supports and Resistances
EURUSD currently trading at 1.0896 at the time of writing. Pair opened at 1.0905 and is trading with a change of -0.08 % .
| Overview | Overview.1 | |
|---|---|---|
| 0 | Today last price | 1.0896 |
| 1 | Today Daily Change | -0.0009 |
| 2 | Today Daily Change % | -0.0800 |
| 3 | Today daily open | 1.0905 |
The pair remains strongly bullish on the daily timeframe. It trades above its 20 SMA @ 1.0714, 50 SMA 1.0732, 100 SMA @ 1.0646 and 200 SMA @ 1.034.
| Trends | Trends.1 | |
|---|---|---|
| 0 | Daily SMA20 | 1.0714 |
| 1 | Daily SMA50 | 1.0732 |
| 2 | Daily SMA100 | 1.0646 |
| 3 | Daily SMA200 | 1.0340 |
The previous day high was 1.0926 while the previous day low was 1.0824. The daily 38.2% Fib levels comes at 1.0887, expected to provide support. Similarly, the daily 61.8% fib level is at 1.0863, expected to provide support.
Note the levels of interest below:
- Pivot support is noted at 1.0844, 1.0782, 1.0741
- Pivot resistance is noted at 1.0947, 1.0988, 1.105
| Levels | Levels.1 |
|---|---|
| Previous Daily High | 1.0926 |
| Previous Daily Low | 1.0824 |
| Previous Weekly High | 1.0930 |
| Previous Weekly Low | 1.0631 |
| Previous Monthly High | 1.1033 |
| Previous Monthly Low | 1.0533 |
| Daily Fibonacci 38.2% | 1.0887 |
| Daily Fibonacci 61.8% | 1.0863 |
| Daily Pivot Point S1 | 1.0844 |
| Daily Pivot Point S2 | 1.0782 |
| Daily Pivot Point S3 | 1.0741 |
| Daily Pivot Point R1 | 1.0947 |
| Daily Pivot Point R2 | 1.0988 |
| Daily Pivot Point R3 | 1.1050 |
[/s2If]
Join Our Telegram Group
")


