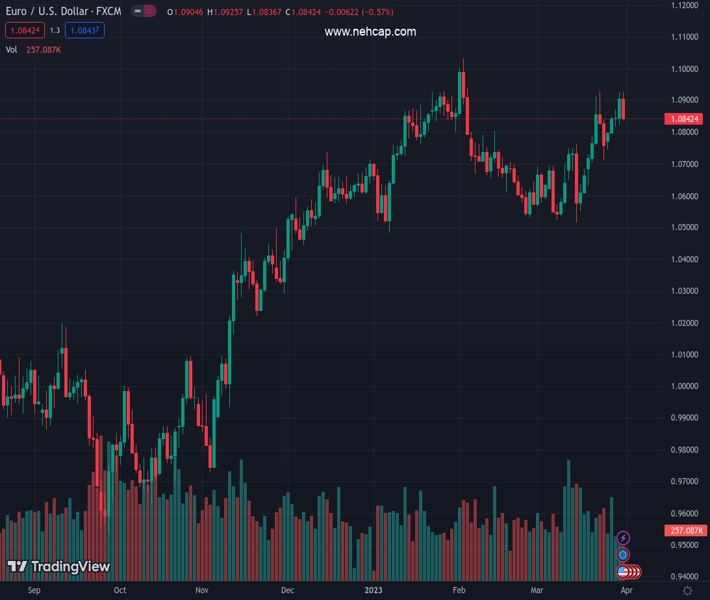
#EURUSD @ 1.08390 A triple bottom in the daily chart remains in play but at a brisk of being negated. (Pivot Orderbook analysis)
…
This is a premium post.
[s2If !current_user_can(access_s2member_level4)]Please register for PREMIUM VERSION HERE to read full post below containing analysis. In case of any error or you think you are not able to read the full post below, please email us at support#nehcap.com [lwa][/s2If] [s2If current_user_can(access_s2member_level4)]
- A triple bottom in the EUR/USD daily chart remains in play but at a brisk of being negated.
- EUR/USD’s price action during the last couple of weeks created a double top, which could shift the pair’s bias.
The pair currently trades last at 1.08390.
The previous day high was 1.0926 while the previous day low was 1.0824. The daily 38.2% Fib levels comes at 1.0887, expected to provide resistance. Similarly, the daily 61.8% fib level is at 1.0863, expected to provide resistance.
The Euro (EUR) drops from around weekly highs of 1.0925 on a buoyant US Dollar (USD) and on buyers’ failure to crack the YTD high at 1.0929. Nevertheless, a triple bottom in the daily chart is intact, at the brisk of being negated. At the time of writing, the EUR/USD is trading at 1.0842.
Failure to hold prices above the 1.0900 figure has exposed the EUR/USD to further selling pressure. A triple bottom in the daily chart remains in play. But, the upward movement was capped at around March’s 23 high of 1.0929, ahead of testing 1.1000.
For a bullish resumption, EUR/USD buyers must reclaim 1.0900, followed by 1.0929. Break above will expose the 1.1000 figure, followed by the YTD high at 1.1032.
Another scenario has developed in the last couple of weeks. Albeit a “triple bottom” is in place, the formation of a double top emerged. Hence, if the EUR/USD continues to dive further and achieves a daily close below the March 24 swing low of 1.0713, it would pave the way to test 1.0500.
Backing up the latter scenario are oscillators. The Relative Strength Index (RSI), although at bullish territory, its slope turned downwards, while the Rate of Change (RoC) shifted neutral.
Technical Levels: Supports and Resistances
EURUSD currently trading at 1.084 at the time of writing. Pair opened at 1.0905 and is trading with a change of -0.6 % .
| Overview | Overview.1 | |
|---|---|---|
| 0 | Today last price | 1.0840 |
| 1 | Today Daily Change | -0.0065 |
| 2 | Today Daily Change % | -0.6000 |
| 3 | Today daily open | 1.0905 |
The pair remains strongly bullish on the daily timeframe. It trades above its 20 SMA @ 1.0714, 50 SMA 1.0732, 100 SMA @ 1.0646 and 200 SMA @ 1.034.
| Trends | Trends.1 | |
|---|---|---|
| 0 | Daily SMA20 | 1.0714 |
| 1 | Daily SMA50 | 1.0732 |
| 2 | Daily SMA100 | 1.0646 |
| 3 | Daily SMA200 | 1.0340 |
The previous day high was 1.0926 while the previous day low was 1.0824. The daily 38.2% Fib levels comes at 1.0887, expected to provide resistance. Similarly, the daily 61.8% fib level is at 1.0863, expected to provide resistance.
Note the levels of interest below:
- Pivot support is noted at 1.0844, 1.0782, 1.0741
- Pivot resistance is noted at 1.0947, 1.0988, 1.105
| Levels | Levels.1 |
|---|---|
| Previous Daily High | 1.0926 |
| Previous Daily Low | 1.0824 |
| Previous Weekly High | 1.0930 |
| Previous Weekly Low | 1.0631 |
| Previous Monthly High | 1.1033 |
| Previous Monthly Low | 1.0533 |
| Daily Fibonacci 38.2% | 1.0887 |
| Daily Fibonacci 61.8% | 1.0863 |
| Daily Pivot Point S1 | 1.0844 |
| Daily Pivot Point S2 | 1.0782 |
| Daily Pivot Point S3 | 1.0741 |
| Daily Pivot Point R1 | 1.0947 |
| Daily Pivot Point R2 | 1.0988 |
| Daily Pivot Point R3 | 1.1050 |
[/s2If]
Join Our Telegram Group
")


