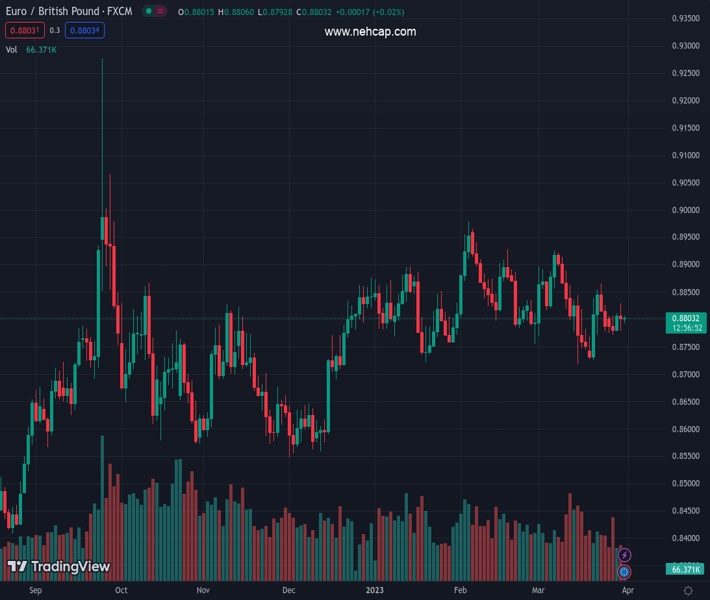
#EURGBP @ 0.88025 moves away from a one-week high, though lacks any follow-through selling. (Pivot Orderbook analysis)
…
This is a premium post.
[s2If !current_user_can(access_s2member_level4)]Please register for PREMIUM VERSION HERE to read full post below containing analysis. In case of any error or you think you are not able to read the full post below, please email us at support#nehcap.com [lwa][/s2If] [s2If current_user_can(access_s2member_level4)]
- EUR/GBP moves away from a one-week high, though lacks any follow-through selling.
- Bets for more rate hikes by the BoE and the ECB hold back traders from placing bets.
- The focus remains glued to the release of the preliminary Eurozone inflation figures.
The pair currently trades last at 0.88025.
The previous day high was 0.8828 while the previous day low was 0.878. The daily 38.2% Fib levels comes at 0.8798, expected to provide support. Similarly, the daily 61.8% fib level is at 0.881, expected to provide resistance.
The EUR/GBP cross edges lower for the second successive day on Friday and retreats further from a one-week high, around the 0.8825-0.8830 region touched the previous day. Spot prices remain on the defensive through the early European session and currently trade around the 0.8800 round-figure mark, down less than 0.05% for the day.
The better-than-expected UK GDP print, showing that the economy expanded by 0.1% during the fourth quarter as compared to the original estimate for zero growth, boosts the British Pound and exerts some pressure on the EUR/GBP cross. The data comes on the back of the Bank of England (BoE) Governor Andrew Bailey’s hawkish remarks earlier this week, saying that interest rates may have to move higher if there were signs of persistent inflationary pressure, and favours the GBP bulls.
The downside for the EUR/GBP cross, however, is more likely to remain cushioned amid bets for a further policy tightening by the European Central Bank (ECB). The expectations were reaffirmed by slightly higher-than-expected German consumer inflation data, which sparked speculation of a potential upside surprise in the Eurozone CPI, due later this Friday. This might hold back traders from placing aggressive bearish bets and act as a tailwind for spot prices, for the time being.
Even from a technical perspective, the EUR/GBP cross, so far, has been finding decent support near the 100-day Simple Moving Average (SMA). The recent price action, meanwhile, constitutes the formation of a descending triangle and favours bearish traders. That said, it will still be prudent to wait for acceptance below the 100-day SMA and a subsequent slide below the 0.8730 horizontal support before positioning for any meaningful depreciating move in the near term.
Technical Levels: Supports and Resistances
EURGBP currently trading at 0.88 at the time of writing. Pair opened at 0.8804 and is trading with a change of -0.05 % .
| Overview | Overview.1 | |
|---|---|---|
| 0 | Today last price | 0.8800 |
| 1 | Today Daily Change | -0.0004 |
| 2 | Today Daily Change % | -0.0500 |
| 3 | Today daily open | 0.8804 |
The pair is trading below its 20 Daily moving average @ 0.882, below its 50 Daily moving average @ 0.8833 , above its 100 Daily moving average @ 0.8781 and above its 200 Daily moving average @ 0.8693
| Trends | Trends.1 | |
|---|---|---|
| 0 | Daily SMA20 | 0.8820 |
| 1 | Daily SMA50 | 0.8833 |
| 2 | Daily SMA100 | 0.8781 |
| 3 | Daily SMA200 | 0.8693 |
The previous day high was 0.8828 while the previous day low was 0.878. The daily 38.2% Fib levels comes at 0.8798, expected to provide support. Similarly, the daily 61.8% fib level is at 0.881, expected to provide resistance.
Note the levels of interest below:
- Pivot support is noted at 0.878, 0.8755, 0.8731
- Pivot resistance is noted at 0.8828, 0.8853, 0.8877
| Levels | Levels.1 |
|---|---|
| Previous Daily High | 0.8828 |
| Previous Daily Low | 0.8780 |
| Previous Weekly High | 0.8866 |
| Previous Weekly Low | 0.8728 |
| Previous Monthly High | 0.8979 |
| Previous Monthly Low | 0.8755 |
| Daily Fibonacci 38.2% | 0.8798 |
| Daily Fibonacci 61.8% | 0.8810 |
| Daily Pivot Point S1 | 0.8780 |
| Daily Pivot Point S2 | 0.8755 |
| Daily Pivot Point S3 | 0.8731 |
| Daily Pivot Point R1 | 0.8828 |
| Daily Pivot Point R2 | 0.8853 |
| Daily Pivot Point R3 | 0.8877 |
[/s2If]
Join Our Telegram Group
")


