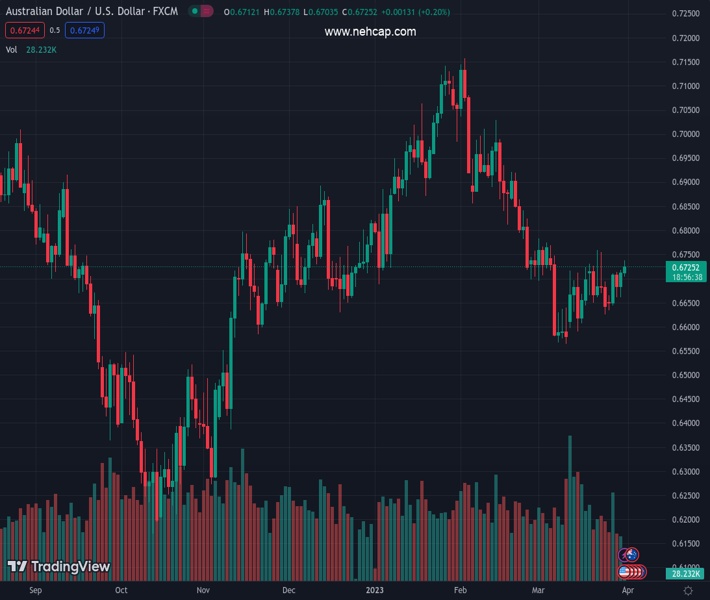
#AUDUSD @ 0.67241 has scaled above 0.6730 as the Chinese official PMI remained better than expectations. (Pivot Orderbook analysis)
…
This is a premium post.
[s2If !current_user_can(access_s2member_level4)]Please register for PREMIUM VERSION HERE to read full post below containing analysis. In case of any error or you think you are not able to read the full post below, please email us at support#nehcap.com [lwa][/s2If] [s2If current_user_can(access_s2member_level4)]
- AUD/USD has scaled above 0.6730 as the Chinese official PMI remained better than expectations.
- Investors are split about the monetary policy decision by the RBA as Australian inflation has softened firmly.
- The USD Index is putting efforts into defending its critical support of 102.10.
The pair currently trades last at 0.67241.
The previous day high was 0.6718 while the previous day low was 0.6661. The daily 38.2% Fib levels comes at 0.6697, expected to provide support. Similarly, the daily 61.8% fib level is at 0.6683, expected to provide support.
The AUD/USD pair has jumped above 0.6730 as China’s National Bureau of Statistics (NBS) has reported better-than-projected PMI figures. Manufacturing PMI has landed at 51.9, higher than the consensus of 51.5 but lower than the former release of 52.6. The Non-Manufacturing PMI has mounted higher at 58.2 vs. the former release of 56.3.
Chinese economy looks steady on its way to economic recovery as the administration is providing various monetary and non-monetary measures to trigger overall demand and accelerate the scale of economic activities. However, Monday’s Caixin Manufacturing PMI data will be keenly watched. Investors should be aware of the fact that Australia is a leading trading partner of China and a higher scale of economic activities will support the Australian Dollar.
Going forward, the Australian Dollar will remain active ahead of the interest rate decision by the Reserve Bank of Australia (RBA).
Investors are split about the monetary policy decision by RBA Governor Philip Lowe as Australian inflation has softened to 6.8% firmly from the December print of 8.4%, which supports the case of keeping policy steady and observing the impact of the current interest rate. Also, RBA Lowe cited in its previous policy statement that the central bank is considering maintenance of the status quo in April. While, the other school of thought believes that despite softening of Australian inflation, the Consumer Price Index (CPI) is still far from the desired target. Therefore, the rate-hiking spell should continue ahead.
On the United States front, the US Dollar Index (DXY) is putting efforts into defending its critical support of 102.10. More action will be seen in the USD Index ahead of the release of the US core Personal Consumption Expenditure (PCE) Price Index data.
Technical Levels: Supports and Resistances
AUDUSD currently trading at 0.6736 at the time of writing. Pair opened at 0.6712 and is trading with a change of 0.36 % .
| Overview | Overview.1 | |
|---|---|---|
| 0 | Today last price | 0.6736 |
| 1 | Today Daily Change | 0.0024 |
| 2 | Today Daily Change % | 0.3600 |
| 3 | Today daily open | 0.6712 |
The pair is trading above its 20 Daily moving average @ 0.6666, below its 50 Daily moving average @ 0.6825 , below its 100 Daily moving average @ 0.68 and below its 200 Daily moving average @ 0.6753
| Trends | Trends.1 | |
|---|---|---|
| 0 | Daily SMA20 | 0.6666 |
| 1 | Daily SMA50 | 0.6825 |
| 2 | Daily SMA100 | 0.6800 |
| 3 | Daily SMA200 | 0.6753 |
The previous day high was 0.6718 while the previous day low was 0.6661. The daily 38.2% Fib levels comes at 0.6697, expected to provide support. Similarly, the daily 61.8% fib level is at 0.6683, expected to provide support.
Note the levels of interest below:
- Pivot support is noted at 0.6676, 0.664, 0.662
- Pivot resistance is noted at 0.6733, 0.6754, 0.679
| Levels | Levels.1 |
|---|---|
| Previous Daily High | 0.6718 |
| Previous Daily Low | 0.6661 |
| Previous Weekly High | 0.6759 |
| Previous Weekly Low | 0.6625 |
| Previous Monthly High | 0.7158 |
| Previous Monthly Low | 0.6698 |
| Daily Fibonacci 38.2% | 0.6697 |
| Daily Fibonacci 61.8% | 0.6683 |
| Daily Pivot Point S1 | 0.6676 |
| Daily Pivot Point S2 | 0.6640 |
| Daily Pivot Point S3 | 0.6620 |
| Daily Pivot Point R1 | 0.6733 |
| Daily Pivot Point R2 | 0.6754 |
| Daily Pivot Point R3 | 0.6790 |
[/s2If]
Join Our Telegram Group
")


