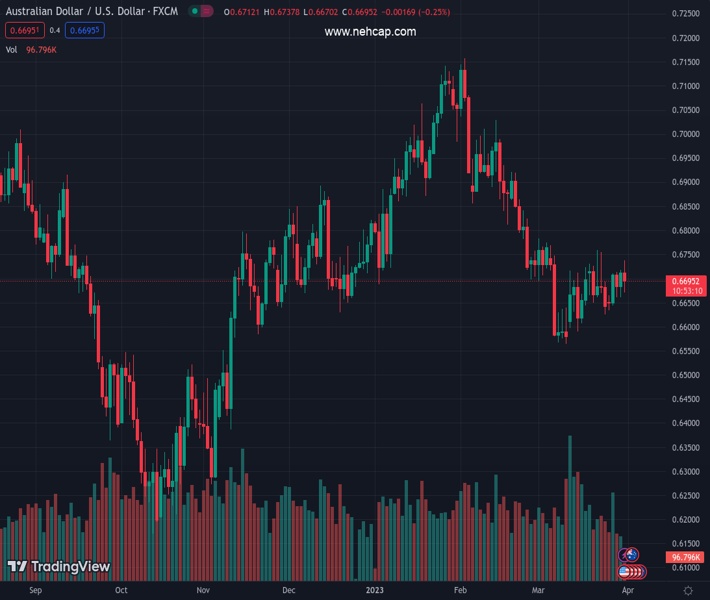
#AUDUSD @ 0.66946 witnessed an intraday turnaround from over a one-week high touched on Friday. (Pivot Orderbook analysis)
…
This is a premium post.
[s2If !current_user_can(access_s2member_level4)]Please register for PREMIUM VERSION HERE to read full post below containing analysis. In case of any error or you think you are not able to read the full post below, please email us at support#nehcap.com [lwa][/s2If] [s2If current_user_can(access_s2member_level4)]
- AUD/USD witnessed an intraday turnaround from over a one-week high touched on Friday.
- Rising US bond yields revive the USD demand and exert downward pressure on the major.
- The downside remains cushioned as traders keenly await the Fed’s preferred inflation data.
The pair currently trades last at 0.66946.
The previous day high was 0.6718 while the previous day low was 0.6661. The daily 38.2% Fib levels comes at 0.6697, expected to provide resistance. Similarly, the daily 61.8% fib level is at 0.6683, expected to provide support.
The AUD/USD pair retreats sharply from over a one-week high, around the 0.6735-0.6740 region touched earlier this Friday and continues losing ground through the first half of the European session. Spot prices reverse the previous day’s positive move and drop to the 0.6670 area, or a fresh daily low in the last hour.
A goodish pickup in the US Treasury bond yields helps revive the US Dollar (USD) demand on the last day of the week, which, in turn, is seen as a key factor exerting downward pressure on the AUD/USD pair. That said, the prevalent risk-on mood – as depicted by a generally positive tone around the equity markets – could lend some support to the risk-sensitive Aussie. Against the backdrop of easing fears about a full-blown banking crisis, the better-than-expected Chinese PMI prints raise hopes for a strong recovery in the world’s second-largest economy and boost investors’ confidence.
Apart from this, the uncertainty over the Federal Reserve’s (Fed) rate hike path could act as a headwind for the US bond yields, which might hold back the USD bulls from placing aggressive bets and contribute to limiting losses for the AUD/USD pair. It is worth recalling that the Fed had signalled recently that it might soon pause the rate-hiking cycle. That said, fading risk of bank contagion fueled speculations that the US central bank might shift back to its inflation-fighting rate hikes. Furthermore, three Fed officials on Thursday backed the case for more rate hikes to contain high inflation.
Hence, the market focus will remain glued to the release of the US Core PCE Price Index – the Fed’s preferred inflation gauge – later during the early North American session. The data will play a key role in influencing market expectations about the next policy move. This, in turn, will drive the USD demand and help determine the next leg of a directional move for the AUD/USD pair. This, along with the emergence of some buying near the 0.6660 area over the past two trading sessions, warrants caution for aggressive bearish traders and before positioning for an extension of the intraday downfall.
Technical Levels: Supports and Resistances
AUDUSD currently trading at 0.6687 at the time of writing. Pair opened at 0.6712 and is trading with a change of -0.37 % .
| Overview | Overview.1 | |
|---|---|---|
| 0 | Today last price | 0.6687 |
| 1 | Today Daily Change | -0.0025 |
| 2 | Today Daily Change % | -0.3700 |
| 3 | Today daily open | 0.6712 |
The pair is trading above its 20 Daily moving average @ 0.6666, below its 50 Daily moving average @ 0.6825 , below its 100 Daily moving average @ 0.68 and below its 200 Daily moving average @ 0.6753
| Trends | Trends.1 | |
|---|---|---|
| 0 | Daily SMA20 | 0.6666 |
| 1 | Daily SMA50 | 0.6825 |
| 2 | Daily SMA100 | 0.6800 |
| 3 | Daily SMA200 | 0.6753 |
The previous day high was 0.6718 while the previous day low was 0.6661. The daily 38.2% Fib levels comes at 0.6697, expected to provide resistance. Similarly, the daily 61.8% fib level is at 0.6683, expected to provide support.
Note the levels of interest below:
- Pivot support is noted at 0.6676, 0.664, 0.662
- Pivot resistance is noted at 0.6733, 0.6754, 0.679
| Levels | Levels.1 |
|---|---|
| Previous Daily High | 0.6718 |
| Previous Daily Low | 0.6661 |
| Previous Weekly High | 0.6759 |
| Previous Weekly Low | 0.6625 |
| Previous Monthly High | 0.7158 |
| Previous Monthly Low | 0.6698 |
| Daily Fibonacci 38.2% | 0.6697 |
| Daily Fibonacci 61.8% | 0.6683 |
| Daily Pivot Point S1 | 0.6676 |
| Daily Pivot Point S2 | 0.6640 |
| Daily Pivot Point S3 | 0.6620 |
| Daily Pivot Point R1 | 0.6733 |
| Daily Pivot Point R2 | 0.6754 |
| Daily Pivot Point R3 | 0.6790 |
[/s2If]
Join Our Telegram Group
")


