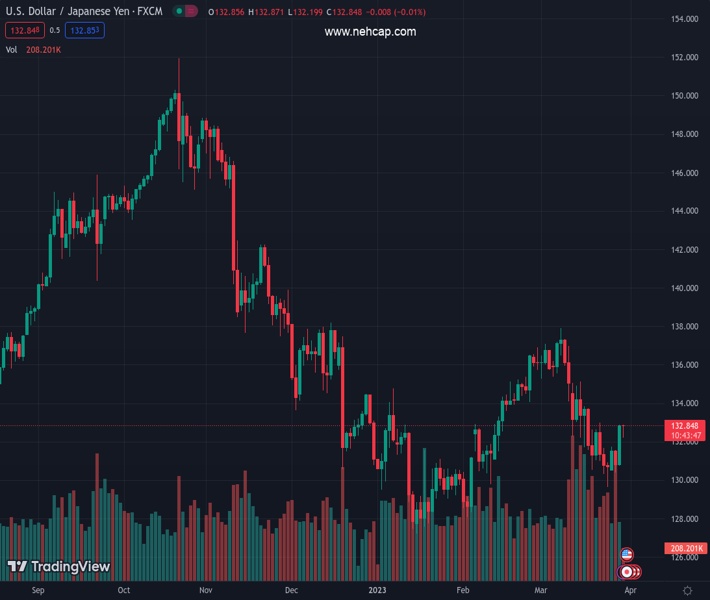
#USDJPY @ 132.789 attracts some dip-buying on Thursday and reverses a major part of its intraday losses. (Pivot Orderbook analysis)
…
This is a premium post.
[s2If !current_user_can(access_s2member_level4)]Please register for PREMIUM VERSION HERE to read full post below containing analysis. In case of any error or you think you are not able to read the full post below, please email us at support#nehcap.com [lwa][/s2If] [s2If current_user_can(access_s2member_level4)]
- USD/JPY attracts some dip-buying on Thursday and reverses a major part of its intraday losses.
- The prevalent risk-on environment undermines the safe-haven JPY and lends support to the pair.
- A modest USD weakness is holding back bullish traders from placing fresh bets around the major.
The pair currently trades last at 132.789.
The previous day high was 132.89 while the previous day low was 130.76. The daily 38.2% Fib levels comes at 132.08, expected to provide support. Similarly, the daily 61.8% fib level is at 131.57, expected to provide support.
The USD/JPY pair rebounds over 50 pips from the daily low and steadily climbs back closer to the top end of its daily trading range during the first half of the European session. The pair is currently placed around the 132.75 region, nearly unchanged for the day and just below the one-week high touched on Wednesday.
An extension of the risk-on rally across the global equity markets undermines the safe-haven Japanese Yen (JPY) and assists the USD/JPY pair to attract some dip-buying near the 132.20 area. The global risk sentiment remains well supported by receding fears of a full-blown banking crisis, especially after the takeover of Silicon Valley Bank by First Citizens Bank & Trust Company. Furthermore, no further cracks have emerged in the banking sector over the past two weeks, which further boosts investors’ appetite for riskier assets and continues to drive flows away from traditional safe-haven currencies, including the JPY.
The upside for the USD/JPY pair, meanwhile, remains capped amid the emergence of some selling around the US Dollar (USD). That said, easing concerns over the banking sector led to fresh speculations that the Federal Reserve (Fed) will move back to its inflation-fighting interest rate hikes. This was seen as a key factor behind the recent strong rally in the US Treasury bond yields, which is seen acting as a tailwind for the Greenback and supports prospects for a further near-term appreciating move for the major. Bulls, however, seem reluctant to place aggressive bets ahead of the crucial US PCE report.
The US Core PCE Price Index – the Fed’s preferred inflation gauge – is due for release on Friday and will expectations about future rate hikes. This, in turn, will drive the USD demand and provide a fresh directional impetus to the USD/JPY pair. In the meantime, traders on Thursday will take cues from the release of the final US Q4 GDP print and the usual Weekly Initial Jobless Claims data for some impetus later during the early North American session. Apart from this, the broader risk sentiment might produce short-term opportunities.
Technical Levels: Supports and Resistances
USDJPY currently trading at 132.76 at the time of writing. Pair opened at 132.86 and is trading with a change of -0.08 % .
| Overview | Overview.1 | |
|---|---|---|
| 0 | Today last price | 132.76 |
| 1 | Today Daily Change | -0.10 |
| 2 | Today Daily Change % | -0.08 |
| 3 | Today daily open | 132.86 |
The pair remains strongly bearish on the daily time frame. It trades below the 20 SMA @ 133.62, 50 SMA 132.8, 100 SMA @ 134.02 and 200 SMA @ 137.34.
| Trends | Trends.1 | |
|---|---|---|
| 0 | Daily SMA20 | 133.62 |
| 1 | Daily SMA50 | 132.80 |
| 2 | Daily SMA100 | 134.02 |
| 3 | Daily SMA200 | 137.34 |
The previous day high was 132.89 while the previous day low was 130.76. The daily 38.2% Fib levels comes at 132.08, expected to provide support. Similarly, the daily 61.8% fib level is at 131.57, expected to provide support.
Note the levels of interest below:
- Pivot support is noted at 131.45, 130.04, 129.32
- Pivot resistance is noted at 133.58, 134.3, 135.71
| Levels | Levels.1 |
|---|---|
| Previous Daily High | 132.89 |
| Previous Daily Low | 130.76 |
| Previous Weekly High | 133.00 |
| Previous Weekly Low | 129.64 |
| Previous Monthly High | 136.92 |
| Previous Monthly Low | 128.08 |
| Daily Fibonacci 38.2% | 132.08 |
| Daily Fibonacci 61.8% | 131.57 |
| Daily Pivot Point S1 | 131.45 |
| Daily Pivot Point S2 | 130.04 |
| Daily Pivot Point S3 | 129.32 |
| Daily Pivot Point R1 | 133.58 |
| Daily Pivot Point R2 | 134.30 |
| Daily Pivot Point R3 | 135.71 |
[/s2If]
Join Our Telegram Group
")


