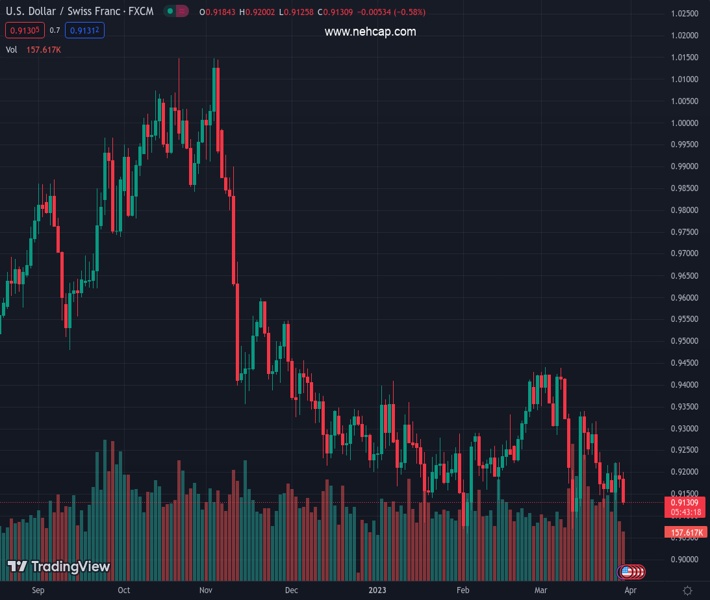
#USDCHF @ 0.91306 Spain and German inflation declined YoY, but core prices still stubbornly high. (Pivot Orderbook analysis)
…
This is a premium post.
[s2If !current_user_can(access_s2member_level4)]Please register for PREMIUM VERSION HERE to read full post below containing analysis. In case of any error or you think you are not able to read the full post below, please email us at support#nehcap.com [lwa][/s2If] [s2If current_user_can(access_s2member_level4)]
- Spain and German inflation declined YoY, but core prices still stubbornly high.
- US Dollar under pressure on risk appetite, Treasuries drift sideways.
- Further weakness in the Dollar could send USD/CHF to test the 0.9050 area.
The pair currently trades last at 0.91306.
The previous day high was 0.9224 while the previous day low was 0.9165. The daily 38.2% Fib levels comes at 0.9187, expected to provide resistance. Similarly, the daily 61.8% fib level is at 0.9201, expected to provide resistance.
The USD/CHF is losing over 50 pips on Thursday following Spain and Germany’s preliminary Consumer Price Index (CPI) numbers and US Jobless Claims. The pair bottomed at 0.9124, the lowest level in a week.
After the beginning of the American session, USD/CHF staged a recovery to 0.9145 but it is back at 0.9130, showing that the bearish pressure persists.
Economic data on Thursday showed mixed numbers regarding inflation in the Eurozone. Spain’s CPI figures came in below expectation, while the German annual CPI declined to 7.4% YoY, above the 7.5% of market consensus.
European markets are rising, with main indexes up by more than 2%. Wall Street is also rising, but off recent highs. The improvement in market sentiment weighs on the US Dollar. The DXY is falling 0.48%, approaching 102.00.
The pair is headed toward the lowest daily close in two weeks and again looks at the long-term critical support area of 0.9050.
If Dollar’s weakness persists, USD/CHF could drop to test the critical area. A break below, would expose 0.9000, and could open the door to significant losses ahead. At the same time, levels near 0.9050 have triggered sharp rebounds in 2023, and also during the fourth quarter of 2021.
Technical Levels: Supports and Resistances
USDCHF currently trading at 0.9131 at the time of writing. Pair opened at 0.9185 and is trading with a change of -0.59 % .
| Overview | Overview.1 | |
|---|---|---|
| 0 | Today last price | 0.9131 |
| 1 | Today Daily Change | -0.0054 |
| 2 | Today Daily Change % | -0.5900 |
| 3 | Today daily open | 0.9185 |
The pair remains strongly bearish on the daily time frame. It trades below the 20 SMA @ 0.9261, 50 SMA 0.9252, 100 SMA @ 0.9305 and 200 SMA @ 0.9524.
| Trends | Trends.1 | |
|---|---|---|
| 0 | Daily SMA20 | 0.9261 |
| 1 | Daily SMA50 | 0.9252 |
| 2 | Daily SMA100 | 0.9305 |
| 3 | Daily SMA200 | 0.9524 |
The previous day high was 0.9224 while the previous day low was 0.9165. The daily 38.2% Fib levels comes at 0.9187, expected to provide resistance. Similarly, the daily 61.8% fib level is at 0.9201, expected to provide resistance.
Note the levels of interest below:
- Pivot support is noted at 0.9159, 0.9133, 0.91
- Pivot resistance is noted at 0.9217, 0.925, 0.9276
| Levels | Levels.1 |
|---|---|
| Previous Daily High | 0.9224 |
| Previous Daily Low | 0.9165 |
| Previous Weekly High | 0.9317 |
| Previous Weekly Low | 0.9120 |
| Previous Monthly High | 0.9429 |
| Previous Monthly Low | 0.9059 |
| Daily Fibonacci 38.2% | 0.9187 |
| Daily Fibonacci 61.8% | 0.9201 |
| Daily Pivot Point S1 | 0.9159 |
| Daily Pivot Point S2 | 0.9133 |
| Daily Pivot Point S3 | 0.9100 |
| Daily Pivot Point R1 | 0.9217 |
| Daily Pivot Point R2 | 0.9250 |
| Daily Pivot Point R3 | 0.9276 |
[/s2If]
Join Our Telegram Group
")


