#NZDUSD @ 0.62610 is expected to continue its upside momentum amid a cheerful market mood. (Pivot Orderbook analysis)
…
This is a premium post.
[s2If !current_user_can(access_s2member_level4)]Please register for PREMIUM VERSION HERE to read full post below containing analysis. In case of any error or you think you are not able to read the full post below, please email us at support#nehcap.com [lwa][/s2If] [s2If current_user_can(access_s2member_level4)]
- NZD/USD is expected to continue its upside momentum amid a cheerful market mood.
- The hawkish commentary from Fed Barkin failed to provide support to the USD Index.
- NZD/USD is at a make or a break near the edge of the Symmetrical Triangle pattern.
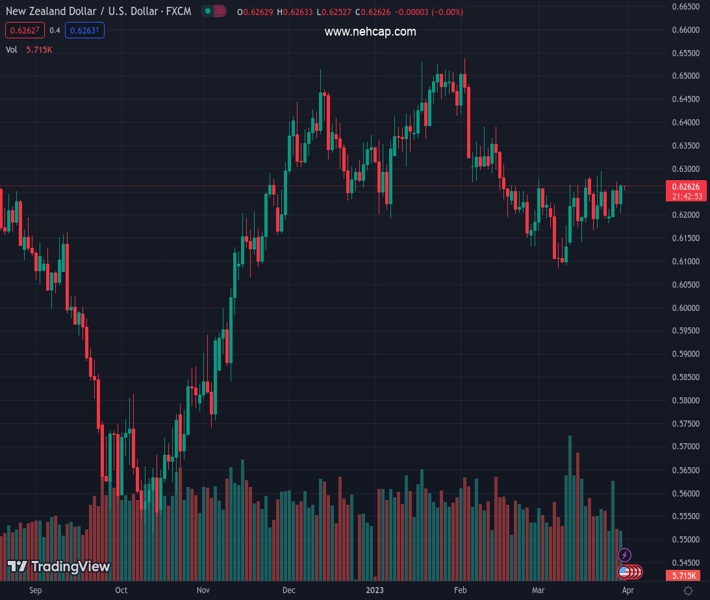
The pair currently trades last at 0.62610.
The previous day high was 0.6272 while the previous day low was 0.6214. The daily 38.2% Fib levels comes at 0.6236, expected to provide support. Similarly, the daily 61.8% fib level is at 0.625, expected to provide support.
The NZD/USD pair is making efforts in keeping its auction above 0.6260 in the early Tokyo session. The Kiwi asset is expected to multiply its upside momentum as the US Dollar Index (DXY) seems vulnerable above 102.00 amid positive market sentiment. The hawkish commentary from Richmond Federal Reserve (Fed) President Thomas Barkin failed to provide support to the USD Index. According to Fed Barkin, there is a lot of money available for spending among households.
S&P500 continued to remain in a positive trajectory as United States authorities have infused confidence among the market participants that the US banking system is ‘sound and resilient’ and a collapse of three mid-size banks cannot shake the overall banking system.
The New Zealand Dollar will remain in action ahead of China’s Caixin Manufacturing PMI data, which will release on Monday. But before that, official PMI data by the National Bureau of Statistics (NBS) will be keenly watched.
It is worth noting that New Zealand is one of the leading trading partners of China and higher PMI figures would also strengthen the New Zealand Dollar.
On a two-hour scale, NZD/USD is at a make or a break near the downward-sloping trendline of the Symmetrical Triangle chart pattern. The downward-sloping trendline of the aforementioned pattern is plotted from March 23 high at 0.6295 while the upward-sloping trendline is placed from Marc 16 low at 0.6161.
The Kiwi asset is auctioning above the 50-period Exponential Moving Average (EMA), which indicates the short-term trend is bullish.
Meanwhile, the Relative Strength Index (RSI) (14) is looking to climb above 60.00, which will result in the activation of bullish momentum.
A decisive break above March 29 high at 0.6272 will drive the asset towards March 23 high at 0.6295 followed by February 07 high at 0.6363.
On the flip side, a breakdown of March 21 low at 0.6167 will drag the asset toward March 15 low at 0.6139. A slippage below the latter will expose the asset for more downside toward the round-level support at 0.6100.
Technical Levels: Supports and Resistances
NZDUSD currently trading at 0.626 at the time of writing. Pair opened at 0.6226 and is trading with a change of 0.55 % .
| Overview | Overview.1 | |
|---|---|---|
| 0 | Today last price | 0.6260 |
| 1 | Today Daily Change | 0.0034 |
| 2 | Today Daily Change % | 0.5500 |
| 3 | Today daily open | 0.6226 |
The pair is trading above its 20 Daily moving average @ 0.62, below its 50 Daily moving average @ 0.6286 , below its 100 Daily moving average @ 0.6291 and above its 200 Daily moving average @ 0.6159
| Trends | Trends.1 | |
|---|---|---|
| 0 | Daily SMA20 | 0.6200 |
| 1 | Daily SMA50 | 0.6286 |
| 2 | Daily SMA100 | 0.6291 |
| 3 | Daily SMA200 | 0.6159 |
The previous day high was 0.6272 while the previous day low was 0.6214. The daily 38.2% Fib levels comes at 0.6236, expected to provide support. Similarly, the daily 61.8% fib level is at 0.625, expected to provide support.
Note the levels of interest below:
- Pivot support is noted at 0.6203, 0.6179, 0.6145
- Pivot resistance is noted at 0.6261, 0.6295, 0.6319
| Levels | Levels.1 |
|---|---|
| Previous Daily High | 0.6272 |
| Previous Daily Low | 0.6214 |
| Previous Weekly High | 0.6295 |
| Previous Weekly Low | 0.6167 |
| Previous Monthly High | 0.6538 |
| Previous Monthly Low | 0.6131 |
| Daily Fibonacci 38.2% | 0.6236 |
| Daily Fibonacci 61.8% | 0.6250 |
| Daily Pivot Point S1 | 0.6203 |
| Daily Pivot Point S2 | 0.6179 |
| Daily Pivot Point S3 | 0.6145 |
| Daily Pivot Point R1 | 0.6261 |
| Daily Pivot Point R2 | 0.6295 |
| Daily Pivot Point R3 | 0.6319 |
[/s2If]
Join Our Telegram Group
")


