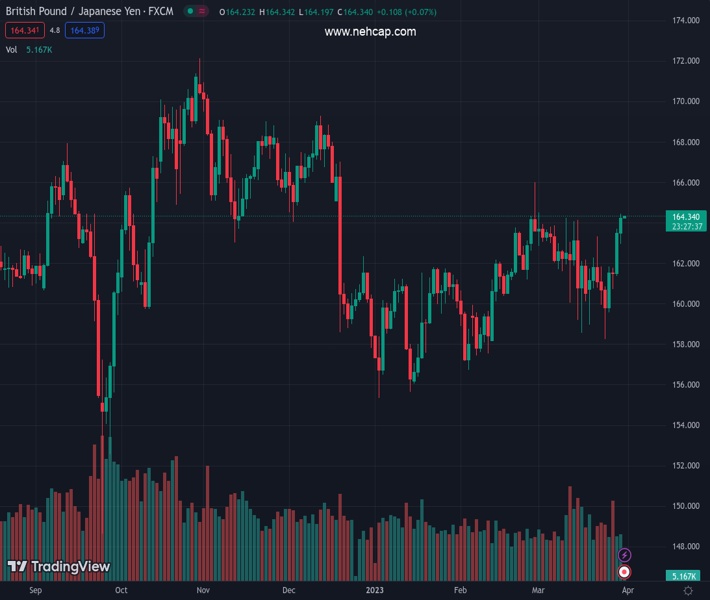
#GBPJPY @ 164.289 The daily chart tests a three-month-old resistance trendline at around 164.70-90. (Pivot Orderbook analysis)
…
This is a premium post.
[s2If !current_user_can(access_s2member_level4)]Please register for PREMIUM VERSION HERE to read full post below containing analysis. In case of any error or you think you are not able to read the full post below, please email us at support#nehcap.com [lwa][/s2If] [s2If current_user_can(access_s2member_level4)]
- The GBP/JPY daily chart tests a three-month-old resistance trendline at around 164.70-90.
- The Relative Strength Index (RSI) and the Rate of Change (RoC) shifted bullish, indicating an upward trend for GBP/JPY.
- GBP/JPY Price Analysis: Downside risks remain below 164.00.
The pair currently trades last at 164.289.
The previous day high was 163.68 while the previous day low was 161.36. The daily 38.2% Fib levels comes at 162.8, expected to provide support. Similarly, the daily 61.8% fib level is at 162.25, expected to provide support.
The GBP/JPY pair is gaining 0.53% on Thursday and is trading at 164.29 after hitting a daily low of 162.96. The pair’s uptrend is attributed to the market’s current risk-on sentiment and expectations that central banks will pause hiking rates after the recent banking turmoil in the US and Switzerland.
The GBP/JPY daily chart suggests the pair is testing a three-month-old resistance trendline that passes at around 164.70-90, trading at 4-week highs. The Relative Strength Index (RSI) shifted bullish, suggesting the GBP/JPY outlook is upwards. The Rate of Change (RoC) jumped from a neutral stance after the GBP/JPY snapped three days of consecutive losses, erased on Thursday.
If the GBP/JPY continues its uptrend, the next resistance would be the February 27 high at 166.00. A breach of the latter will expose the December 19 daily high at 167.01, followed by the December 12 high at 169.27.
On the other hand, the GBP/JPY first support would be the psychological level at 164.00. Downside risks lie at the next support area at the 20-day Exponential Moving Average (EMA) at 161.87, ahead of testing the 50-day EMA at 161.18.
Technical Levels: Supports and Resistances
GBPJPY currently trading at 164.33 at the time of writing. Pair opened at 163.6 and is trading with a change of 0.45 % .
| Overview | Overview.1 | |
|---|---|---|
| 0 | Today last price | 164.33 |
| 1 | Today Daily Change | 0.73 |
| 2 | Today Daily Change % | 0.45 |
| 3 | Today daily open | 163.60 |
The pair remains strongly bullish on the daily timeframe. It trades above its 20 SMA @ 162.02, 50 SMA 161.32, 100 SMA @ 162.37 and 200 SMA @ 163.18.
| Trends | Trends.1 | |
|---|---|---|
| 0 | Daily SMA20 | 162.02 |
| 1 | Daily SMA50 | 161.32 |
| 2 | Daily SMA100 | 162.37 |
| 3 | Daily SMA200 | 163.18 |
The previous day high was 163.68 while the previous day low was 161.36. The daily 38.2% Fib levels comes at 162.8, expected to provide support. Similarly, the daily 61.8% fib level is at 162.25, expected to provide support.
Note the levels of interest below:
- Pivot support is noted at 162.07, 160.55, 159.75
- Pivot resistance is noted at 164.4, 165.21, 166.73
| Levels | Levels.1 |
|---|---|
| Previous Daily High | 163.68 |
| Previous Daily Low | 161.36 |
| Previous Weekly High | 163.34 |
| Previous Weekly Low | 158.27 |
| Previous Monthly High | 166.01 |
| Previous Monthly Low | 156.73 |
| Daily Fibonacci 38.2% | 162.80 |
| Daily Fibonacci 61.8% | 162.25 |
| Daily Pivot Point S1 | 162.07 |
| Daily Pivot Point S2 | 160.55 |
| Daily Pivot Point S3 | 159.75 |
| Daily Pivot Point R1 | 164.40 |
| Daily Pivot Point R2 | 165.21 |
| Daily Pivot Point R3 | 166.73 |
[/s2If]
Join Our Telegram Group
")


