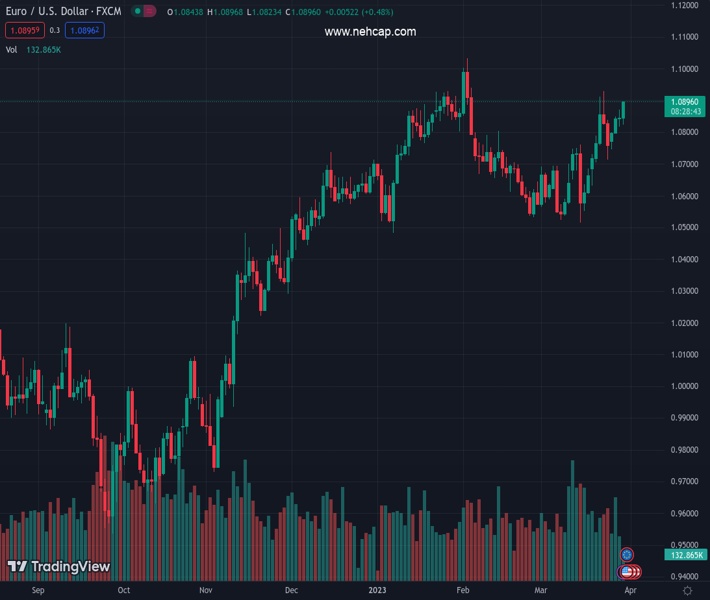
#EURUSD @ 1.08942 Euro hits fresh highs following Eurozone inflation data. (Pivot Orderbook analysis)
…
This is a premium post.
[s2If !current_user_can(access_s2member_level4)]Please register for PREMIUM VERSION HERE to read full post below containing analysis. In case of any error or you think you are not able to read the full post below, please email us at support#nehcap.com [lwa][/s2If] [s2If current_user_can(access_s2member_level4)]
- Euro hits fresh highs following Eurozone inflation data.
- German preliminary March annual inflation at 7.4%, above 7.3% expected.
- EUR/USD approaches 1.0900, looking bullish while above 1.0820.
The pair currently trades last at 1.08942.
The previous day high was 1.0871 while the previous day low was 1.0818. The daily 38.2% Fib levels comes at 1.0851, expected to provide support. Similarly, the daily 61.8% fib level is at 1.0838, expected to provide support.
The EUR/USD rose further following the release of German inflation figures and climbed to 1.0891, reaching the highest level in a week. The pair remains near the highs, supported by a stronger Euro.
Data released on Thursday showed that inflation in Germany, the Consumer Price Index (CPI), declined to 7.4% YoY in March from 8.7% in February, above the 7.5% of market consensus. The CPI rose 0.8% in March according to the preliminary report, above the 0.7% estimated, matching February’s print.
The data shows a sharp slowdown in the annual rate in Germany, to the lowest since August 2022, but higher than expected. Earlier, Spain surprised with a softer-than-expected CPI. The German 10-year bund yield jumped after the data to 2.35%, the highest level in a week.
In a few minutes, the US will report Jobless Claims and the third estimate of Q4 GDP growth.
The EUR/USD is approaching the 1.0900 mark. If it holds firm above 1.0905, a test of last week’s high at 1.0929 seems likely. On the contrary, 1.0860 has become a support level, followed by 1.0825.
Technical Levels: Supports and Resistances
EURUSD currently trading at 1.0886 at the time of writing. Pair opened at 1.0844 and is trading with a change of 0.39 % .
| Overview | Overview.1 | |
|---|---|---|
| 0 | Today last price | 1.0886 |
| 1 | Today Daily Change | 0.0042 |
| 2 | Today Daily Change % | 0.3900 |
| 3 | Today daily open | 1.0844 |
The pair remains strongly bullish on the daily timeframe. It trades above its 20 SMA @ 1.0698, 50 SMA 1.073, 100 SMA @ 1.0639 and 200 SMA @ 1.0338.
| Trends | Trends.1 | |
|---|---|---|
| 0 | Daily SMA20 | 1.0698 |
| 1 | Daily SMA50 | 1.0730 |
| 2 | Daily SMA100 | 1.0639 |
| 3 | Daily SMA200 | 1.0338 |
The previous day high was 1.0871 while the previous day low was 1.0818. The daily 38.2% Fib levels comes at 1.0851, expected to provide support. Similarly, the daily 61.8% fib level is at 1.0838, expected to provide support.
Note the levels of interest below:
- Pivot support is noted at 1.0818, 1.0791, 1.0764
- Pivot resistance is noted at 1.0871, 1.0898, 1.0925
| Levels | Levels.1 |
|---|---|
| Previous Daily High | 1.0871 |
| Previous Daily Low | 1.0818 |
| Previous Weekly High | 1.0930 |
| Previous Weekly Low | 1.0631 |
| Previous Monthly High | 1.1033 |
| Previous Monthly Low | 1.0533 |
| Daily Fibonacci 38.2% | 1.0851 |
| Daily Fibonacci 61.8% | 1.0838 |
| Daily Pivot Point S1 | 1.0818 |
| Daily Pivot Point S2 | 1.0791 |
| Daily Pivot Point S3 | 1.0764 |
| Daily Pivot Point R1 | 1.0871 |
| Daily Pivot Point R2 | 1.0898 |
| Daily Pivot Point R3 | 1.0925 |
[/s2If]
Join Our Telegram Group
")


