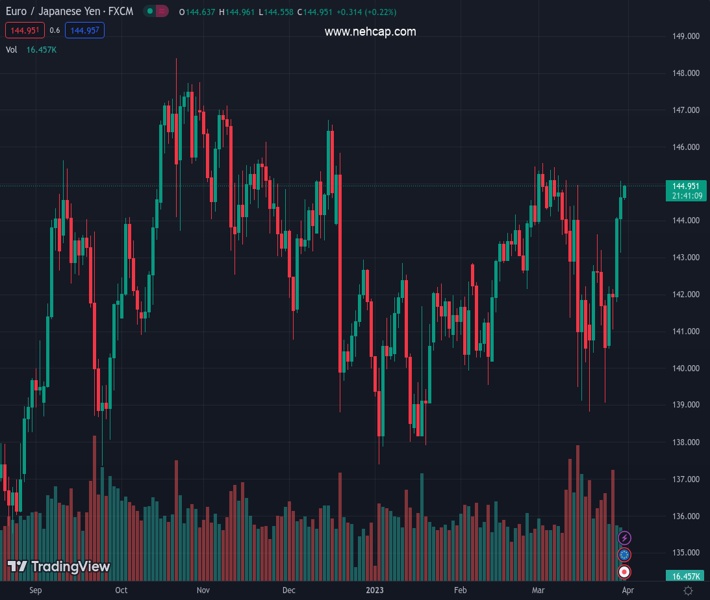
#EURJPY @ 144.700 draws a double bottom in the daily chart, implying that the pair could test the last year’s high. (Pivot Orderbook analysis)
…
This is a premium post.
[s2If !current_user_can(access_s2member_level4)]Please register for PREMIUM VERSION HERE to read full post below containing analysis. In case of any error or you think you are not able to read the full post below, please email us at support#nehcap.com [lwa][/s2If] [s2If current_user_can(access_s2member_level4)]
- EUR/JPY draws a double bottom in the daily chart, implying that the pair could test the last year’s high.
- EUR/JPY Price Analysis: Breaking a five-month-old resistance trendline could open the door to testing the 2022 high.
The pair currently trades last at 144.700.
The previous day high was 144.1 while the previous day low was 141.79. The daily 38.2% Fib levels comes at 143.22, expected to provide support. Similarly, the daily 61.8% fib level is at 142.68, expected to provide support.
The EUR/JPY edges higher after cracking a four-week-old resistance trendline and climbs above 144.00 as the Asian session begins. At the time of writing, the EUR/JPY exchanges hands at around 144.70, registering minuscule gains of 0.05%.
From a longer-term perspective, the EUR/JPY formed a double bottom, meaning that the EUR/JPY pair is upward biased. Once the EUR/JPY cleared a one-month-old resistance trendline, it would collide with a five-month-old resistance trendline at 145.00. A decisive break above the latter would send the EUR/JPY pair rallying toward a 2022 high of 148.40, but it would face some hurdles on its way north.
Hence, the EUR/JPY’s first resistance would be March’s high at 145.56, followed by the 145.83 high of December 20. Upside risks would follow at the December 15 high at 146.72, followed by 2022 high at 148.40.
In an alternate scenario, the EUR/JPY first support would be the March 30 low at 143.13. A decisive break, and the subsequent demand area tested, would be the 20-day EMA at 142.93, followed by the 50 and 100-day EMAs, each at 142.70 and 142.42. If the downtrend continues, the 200-day EMA at 141.16 would be next.
Technical Levels: Supports and Resistances
EURJPY currently trading at 144.86 at the time of writing. Pair opened at 144.07 and is trading with a change of 0.55 % .
| Overview | Overview.1 | |
|---|---|---|
| 0 | Today last price | 144.86 |
| 1 | Today Daily Change | 0.79 |
| 2 | Today Daily Change % | 0.55 |
| 3 | Today daily open | 144.07 |
The pair remains strongly bullish on the daily timeframe. It trades above its 20 SMA @ 142.94, 50 SMA 142.47, 100 SMA @ 142.53 and 200 SMA @ 141.83.
| Trends | Trends.1 | |
|---|---|---|
| 0 | Daily SMA20 | 142.94 |
| 1 | Daily SMA50 | 142.47 |
| 2 | Daily SMA100 | 142.53 |
| 3 | Daily SMA200 | 141.83 |
The previous day high was 144.1 while the previous day low was 141.79. The daily 38.2% Fib levels comes at 143.22, expected to provide support. Similarly, the daily 61.8% fib level is at 142.68, expected to provide support.
Note the levels of interest below:
- Pivot support is noted at 142.54, 141.01, 140.23
- Pivot resistance is noted at 144.85, 145.63, 147.16
| Levels | Levels.1 |
|---|---|
| Previous Daily High | 144.10 |
| Previous Daily Low | 141.79 |
| Previous Weekly High | 143.63 |
| Previous Weekly Low | 138.83 |
| Previous Monthly High | 145.47 |
| Previous Monthly Low | 139.55 |
| Daily Fibonacci 38.2% | 143.22 |
| Daily Fibonacci 61.8% | 142.68 |
| Daily Pivot Point S1 | 142.54 |
| Daily Pivot Point S2 | 141.01 |
| Daily Pivot Point S3 | 140.23 |
| Daily Pivot Point R1 | 144.85 |
| Daily Pivot Point R2 | 145.63 |
| Daily Pivot Point R3 | 147.16 |
[/s2If]
Join Our Telegram Group
")


