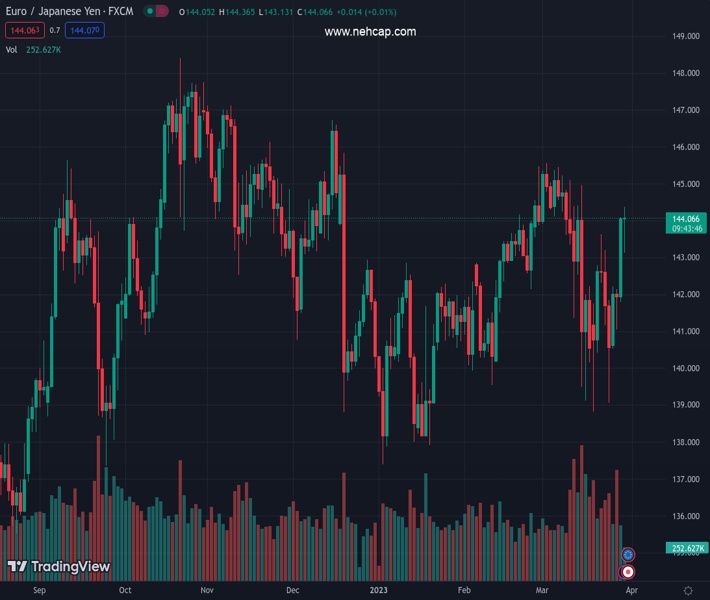
#EURJPY @ 144.121 picks up extra pace and trespasses the 144.00 hurdle. (Pivot Orderbook analysis)
…
This is a premium post.
[s2If !current_user_can(access_s2member_level4)]Please register for PREMIUM VERSION HERE to read full post below containing analysis. In case of any error or you think you are not able to read the full post below, please email us at support#nehcap.com [lwa][/s2If] [s2If current_user_can(access_s2member_level4)]
- EUR/JPY picks up extra pace and trespasses the 144.00 hurdle.
- Extra advance could put the YTD high near 145.60 to the test.
The pair currently trades last at 144.121.
The previous day high was 144.1 while the previous day low was 141.79. The daily 38.2% Fib levels comes at 143.22, expected to provide support. Similarly, the daily 61.8% fib level is at 142.68, expected to provide support.
EUR/JPY adds to the weekly optimism and extends the strong rebound north of 144.00 the figure on Thursday, or 2-week peaks.
Following the breakout of the key 200-day SMA (141.80), the cross could now accelerate gains to the 2023 top at 145.56 (March 2). The surpass of this level could motivate the cross to embark on a potential visit to the December 2022 high around 146.70 (December 15).
In the meantime, extra gains remain on the table while the cross trades above the 200-day SMA.
Technical Levels: Supports and Resistances
EURJPY currently trading at 144.23 at the time of writing. Pair opened at 144.07 and is trading with a change of 0.11 % .
| Overview | Overview.1 | |
|---|---|---|
| 0 | Today last price | 144.23 |
| 1 | Today Daily Change | 123.00 |
| 2 | Today Daily Change % | 0.11 |
| 3 | Today daily open | 144.07 |
The pair remains strongly bullish on the daily timeframe. It trades above its 20 SMA @ 142.94, 50 SMA 142.47, 100 SMA @ 142.53 and 200 SMA @ 141.83.
| Trends | Trends.1 | |
|---|---|---|
| 0 | Daily SMA20 | 142.94 |
| 1 | Daily SMA50 | 142.47 |
| 2 | Daily SMA100 | 142.53 |
| 3 | Daily SMA200 | 141.83 |
The previous day high was 144.1 while the previous day low was 141.79. The daily 38.2% Fib levels comes at 143.22, expected to provide support. Similarly, the daily 61.8% fib level is at 142.68, expected to provide support.
Note the levels of interest below:
- Pivot support is noted at 142.54, 141.01, 140.23
- Pivot resistance is noted at 144.85, 145.63, 147.16
| Levels | Levels.1 |
|---|---|
| Previous Daily High | 144.10 |
| Previous Daily Low | 141.79 |
| Previous Weekly High | 143.63 |
| Previous Weekly Low | 138.83 |
| Previous Monthly High | 145.47 |
| Previous Monthly Low | 139.55 |
| Daily Fibonacci 38.2% | 143.22 |
| Daily Fibonacci 61.8% | 142.68 |
| Daily Pivot Point S1 | 142.54 |
| Daily Pivot Point S2 | 141.01 |
| Daily Pivot Point S3 | 140.23 |
| Daily Pivot Point R1 | 144.85 |
| Daily Pivot Point R2 | 145.63 |
| Daily Pivot Point R3 | 147.16 |
[/s2If]
Join Our Telegram Group
")


