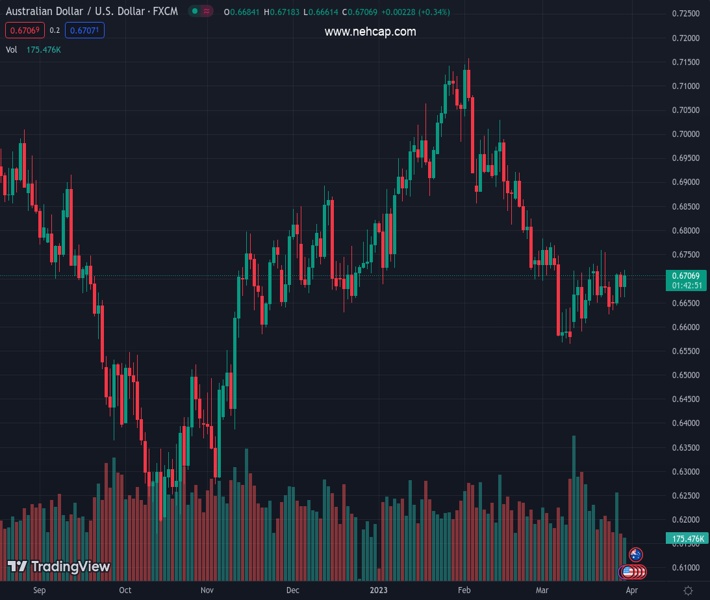
#AUDUSD @ 0.67075 climbs as market participants expect a US Federal Reserve pivot on its monetary policy stance. (Pivot Orderbook analysis)
…
This is a premium post.
[s2If !current_user_can(access_s2member_level4)]Please register for PREMIUM VERSION HERE to read full post below containing analysis. In case of any error or you think you are not able to read the full post below, please email us at support#nehcap.com [lwa][/s2If] [s2If current_user_can(access_s2member_level4)]
- AUD/USD climbs as market participants expect a US Federal Reserve pivot on its monetary policy stance.
- Boston Fed’s Susan Collins argues that the Fed will maintain steady rates after a future hike.
- Richmond Fed’s Thomas Barkin commented that turmoil at Credit Suisse removed 50 bps rate hikes off the table.
The pair currently trades last at 0.67075.
The previous day high was 0.6713 while the previous day low was 0.6662. The daily 38.2% Fib levels comes at 0.6681, expected to provide support. Similarly, the daily 61.8% fib level is at 0.6693, expected to provide support.
The Australian Dollar (AUD) edges higher against the US Dollar (USD), which continues to weaken across the board, as shown by a basket of six currencies, namely the US Dollar Index. In addition, US Treasury bond yields are falling, and US equities are climbing, painting a challenging outlook for the US currency. At the time of writing, the AUD/USD is trading at 0.6701.
Risk appetite continues to be the main driver after the banking crisis woes eased. The financial markets narrative shifted back to central banks, though not inflation but regulation. However, Federal Reserve officials like Boston Fed President Susan Collins and Richmond’s Thomas Barkin crossed news wires and spoke about monetary policy.
Boston Fed Susan Collins said that getting inflation low justifies no rate cuts. She added that the US Federal Reserve (Fed) would hold rates steady after another hike. Richmond Fed President Thomas Barkin commented that the inflation fight would take some time and that Credit Suisse’s turmoil took off the table of a 50 bps rate hike.
Even though both Fed officials looked mildly hawkish, investors had begun pricing in a no change to the Federal Funds Rate (FFR) at the upcoming meeting in May. Therefore, the AUD/USD has been underpinned by a probable shift in the US central bank monetary policy stance, though inflation data is waiting to be released on Friday.
Aside from this, jobs data from the United States (US) showed that the labor market is cooling off, with Initial Jobless Claims for the last week exceeding estimates. At the same time, the US Gross Domestic Product (GDP) for Q4 2022 was 2.6%, below forecasts of 2.7%.
On the Australian front, the latest inflation report surprised the market, as inflation was lower than expected. There are growing rumors amongst financial analysts that the Reserve Bank of Australia (RBA) could pause rate hikes in the next week.
The AUD/USD is bracing for the 20-day Exponential Moving Average (EMA), at 0.6696, consolidating within a narrow 70 pip range during the last three trading days. Although oscillators remain in bearish territory, like the Relative Strength Index (RSI), the Rate of Change (RoC) is bullish. Hence, mixed signals warrant caution.
If the AUD/USD breaks upwards, it will face resistance at the 50-day EMA at 0.6753, followed by the 100 and the 200-day EMAs at 0.6771 and 0.6821, respectively. On the other hand, the AUD/USD first demand level would be the March 24 low at 0.6625, followed by the 0.6600 figure.
Technical Levels: Supports and Resistances
AUDUSD currently trading at 0.6709 at the time of writing. Pair opened at 0.6684 and is trading with a change of 0.37 % .
| Overview | Overview.1 | |
|---|---|---|
| 0 | Today last price | 0.6709 |
| 1 | Today Daily Change | 0.0025 |
| 2 | Today Daily Change % | 0.3700 |
| 3 | Today daily open | 0.6684 |
The pair is trading above its 20 Daily moving average @ 0.6667, below its 50 Daily moving average @ 0.6829 , below its 100 Daily moving average @ 0.6799 and below its 200 Daily moving average @ 0.6754
| Trends | Trends.1 | |
|---|---|---|
| 0 | Daily SMA20 | 0.6667 |
| 1 | Daily SMA50 | 0.6829 |
| 2 | Daily SMA100 | 0.6799 |
| 3 | Daily SMA200 | 0.6754 |
The previous day high was 0.6713 while the previous day low was 0.6662. The daily 38.2% Fib levels comes at 0.6681, expected to provide support. Similarly, the daily 61.8% fib level is at 0.6693, expected to provide support.
Note the levels of interest below:
- Pivot support is noted at 0.6659, 0.6635, 0.6608
- Pivot resistance is noted at 0.6711, 0.6738, 0.6763
| Levels | Levels.1 |
|---|---|
| Previous Daily High | 0.6713 |
| Previous Daily Low | 0.6662 |
| Previous Weekly High | 0.6759 |
| Previous Weekly Low | 0.6625 |
| Previous Monthly High | 0.7158 |
| Previous Monthly Low | 0.6698 |
| Daily Fibonacci 38.2% | 0.6681 |
| Daily Fibonacci 61.8% | 0.6693 |
| Daily Pivot Point S1 | 0.6659 |
| Daily Pivot Point S2 | 0.6635 |
| Daily Pivot Point S3 | 0.6608 |
| Daily Pivot Point R1 | 0.6711 |
| Daily Pivot Point R2 | 0.6738 |
| Daily Pivot Point R3 | 0.6763 |
[/s2If]
Join Our Telegram Group
")


