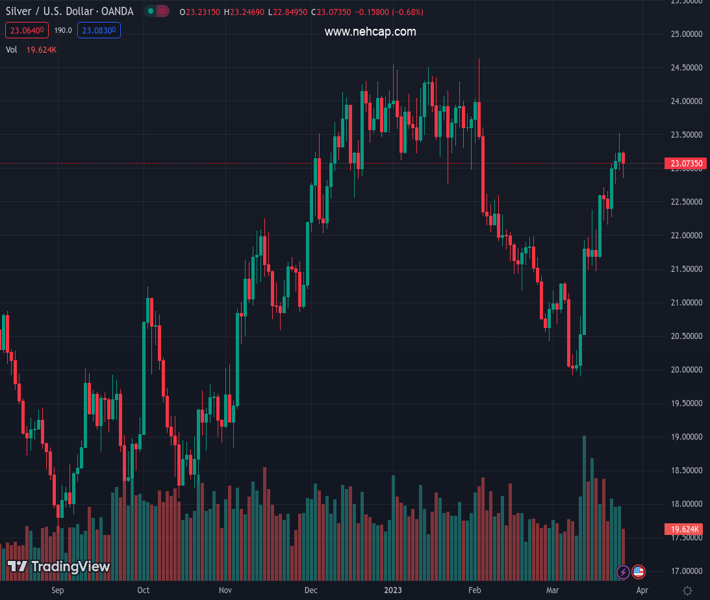
#XAGUSD @ 23.070 Silver’s daily chart indicates a neutral to upward bias, although the 20-day EMA crossed above the 50-day EMA. (Pivot Orderbook analysis)
…
This is a premium post.
[s2If !current_user_can(access_s2member_level4)]Please register for PREMIUM VERSION HERE to read full post below containing analysis. In case of any error or you think you are not able to read the full post below, please email us at support#nehcap.com [lwa][/s2If] [s2If current_user_can(access_s2member_level4)]
- Silver’s daily chart indicates a neutral to upward bias, although the 20-day EMA crossed above the 50-day EMA.
- The appearance of back-to-back hammers on Friday and Monday could signal a possible pullback.
- XAG/USD Price Analysis:
- ounces off 20-EMA, set to challenge resistance at $23.09
The pair currently trades last at 23.070.
The previous day high was 23.52 while the previous day low was 22.97. The daily 38.2% Fib levels comes at 23.31, expected to provide resistance. Similarly, the daily 61.8% fib level is at 23.18, expected to provide resistance.
Silver price clashes with solid resistance and dwindles after hitting a daily high of $23.26. At the time of writing, the white metal is down 0.69%, trading at $23.06, a troy ounce.
Silver’s daily chart suggests the XAG/USD is neutral to upward biased, with the 20-day Exponential Moving Average (EMA) crossing above the 50-day EMA. Nevertheless, back-to-back hammers, last Friday’s inverted and Monday’s price action, could open the door for a pullback. In bullish territory, the Relative Strength Index (RSI) favors higher prices, but its slope turned south, while the Rate of Change (RoC) is neutral. That said, mixed signals warrant caution.
Short-term, the XAG/USD 4-hour chart indicates the pair is consolidating. The XAG/USD dipped toward the 20-EMA at $22.93, bouncing off and reclaiming the $23.00 figure. That, alongside the recent cross of the 100-EMA over the 200-EMA, could exacerbate a rally toward new YTD highs. Additionally, the Relative Strength Index (RSI) and the Rate of Change (RoC) shifted upwards.
Given the backdrop, the XAG/USD first resistance would be the March 27 high at $23.09. Once cleared, the white metal would be poised to test, the last week was high at $23.52 before challenging $24.00.
Technical Levels: Supports and Resistances
XAGUSD currently trading at 23.08 at the time of writing. Pair opened at 23.24 and is trading with a change of -0.69 % .
| Overview | Overview.1 | |
|---|---|---|
| 0 | Today last price | 23.08 |
| 1 | Today Daily Change | -0.16 |
| 2 | Today Daily Change % | -0.69 |
| 3 | Today daily open | 23.24 |
The pair remains strongly bullish on the daily timeframe. It trades above its 20 SMA @ 21.51, 50 SMA 22.24, 100 SMA @ 22.48 and 200 SMA @ 20.98.
| Trends | Trends.1 | |
|---|---|---|
| 0 | Daily SMA20 | 21.51 |
| 1 | Daily SMA50 | 22.24 |
| 2 | Daily SMA100 | 22.48 |
| 3 | Daily SMA200 | 20.98 |
The previous day high was 23.52 while the previous day low was 22.97. The daily 38.2% Fib levels comes at 23.31, expected to provide resistance. Similarly, the daily 61.8% fib level is at 23.18, expected to provide resistance.
Note the levels of interest below:
- Pivot support is noted at 22.97, 22.69, 22.41
- Pivot resistance is noted at 23.52, 23.8, 24.08
| Levels | Levels.1 |
|---|---|
| Previous Daily High | 23.52 |
| Previous Daily Low | 22.97 |
| Previous Weekly High | 23.52 |
| Previous Weekly Low | 22.16 |
| Previous Monthly High | 24.64 |
| Previous Monthly Low | 20.42 |
| Daily Fibonacci 38.2% | 23.31 |
| Daily Fibonacci 61.8% | 23.18 |
| Daily Pivot Point S1 | 22.97 |
| Daily Pivot Point S2 | 22.69 |
| Daily Pivot Point S3 | 22.41 |
| Daily Pivot Point R1 | 23.52 |
| Daily Pivot Point R2 | 23.80 |
| Daily Pivot Point R3 | 24.08 |
[/s2If]
Join Our Telegram Group
")


