WTI advances on sentiment, Kurdistan oil exports halt. (Pivot Orderbook analysis)
…
This is a premium post.
[s2If !current_user_can(access_s2member_level4)]Please register for PREMIUM VERSION HERE to read full post below containing analysis. In case of any error or you think you are not able to read the full post below, please email us at support#nehcap.com [lwa][/s2If] [s2If current_user_can(access_s2member_level4)]
- WTI advances on sentiment, Kurdistan oil exports halt.
- Investors shrugged off the US banking system woes after First Citizens BankShares acquired Silicon Valley Bank.
- WTI Price Analysis: Stuck in neutral to the downward trend but could rally to $80.00 once RSI turns bullish.
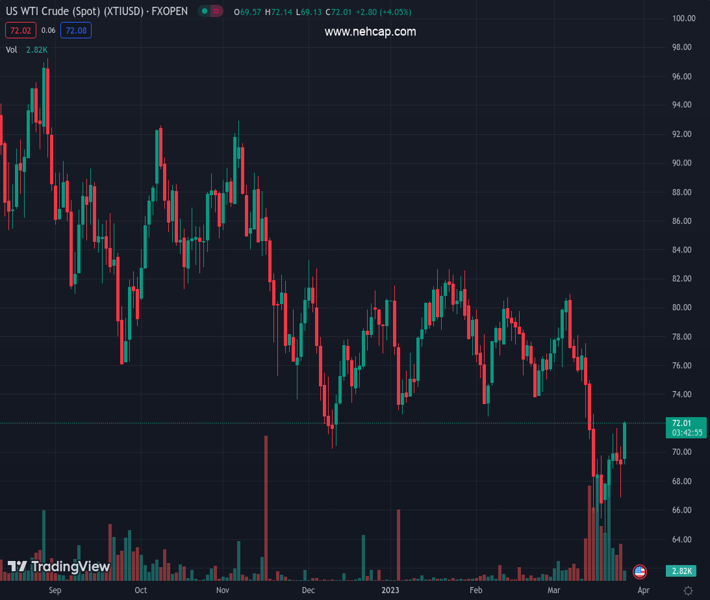
The pair currently trades last at 71.78.
The previous day high was 70.42 while the previous day low was 66.89. The daily 38.2% Fib levels comes at 68.23, expected to provide support. Similarly, the daily 61.8% fib level is at 69.07, expected to provide support.
Western Texas Intermediate (WTI), the US crude oil benchmark, advances sharply on an upbeat sentiment. Another reason for oil’s jump was a halt to oil exports from Iraq Kurdistan and Putin’s nuclear threats. At the time of writing, WTI is trading at $71.13 per barrel.
A confidence vote in the banking system sparked a shift in market mood after First Citizens BankShares, Inc. takeover the Silicon Valley Bank (SVB). Reports emerging that US authorities are considering expanding emergency lending facilities gave another reason for hope, which was cheered by investors.
WTI’s reversed its course after a dragonfly doji emerged on its daily chart after Friday’s close. Hence, oil traders threaten to push prices to the 20-day EMA at $72.10.
In the middle east, an arbitrage case won by Baghdad halted 450K bpd exports from Kurdistan to Turkey due to Kurdistan’s need for Iraq’s consent to ship oil.
Russian President Vladimir Putin’s announcement to deploy tactical nuclear weapons in Belarus in an attempt to intimidate the West due to its support for Ukraine also contributed to the increase in oil prices. NATO described Putin’s comments as “dangerous and irresponsible:, and Ukraine called for a UN Security Council meeting.
At the same time, Russia’s Deputy Prime minister Alexander Novak commented that Moscow is close to achieving its 500K crude output, to about 9.5 million bpd.
WTI is still neutral to downward biased, though approaching the 20-day EMA. Oscillators remain bearish, with the Relative Strength Index (RSI) below 50, but it’s aiming up. So, if RSI turns bullish, WTI’s could rally to $80.00. Hence, WTI’s first resistance would be the 20-day EMA at $72.10. A breach of the latter will expose the 50-day EMA at $74.93, followed by the 100-day EMA at $78.06, before testing $80.00.
Technical Levels: Supports and Resistances
XTIUSD currently trading at 71.78 at the time of writing. Pair opened at 69.28 and is trading with a change of 3.61 % .
| Overview | Overview.1 | |
|---|---|---|
| 0 | Today last price | 71.78 |
| 1 | Today Daily Change | 2.50 |
| 2 | Today Daily Change % | 3.61 |
| 3 | Today daily open | 69.28 |
The pair remains strongly bearish on the daily time frame. It trades below the 20 SMA @ 73.56, 50 SMA 76.43, 100 SMA @ 77.64 and 200 SMA @ 84.45.
| Trends | Trends.1 | |
|---|---|---|
| 0 | Daily SMA20 | 73.56 |
| 1 | Daily SMA50 | 76.43 |
| 2 | Daily SMA100 | 77.64 |
| 3 | Daily SMA200 | 84.45 |
The previous day high was 70.42 while the previous day low was 66.89. The daily 38.2% Fib levels comes at 68.23, expected to provide support. Similarly, the daily 61.8% fib level is at 69.07, expected to provide support.
Note the levels of interest below:
- Pivot support is noted at 67.31, 65.33, 63.78
- Pivot resistance is noted at 70.84, 72.39, 74.37
| Levels | Levels.1 |
|---|---|
| Previous Daily High | 70.42 |
| Previous Daily Low | 66.89 |
| Previous Weekly High | 71.69 |
| Previous Weekly Low | 64.39 |
| Previous Monthly High | 80.75 |
| Previous Monthly Low | 72.50 |
| Daily Fibonacci 38.2% | 68.23 |
| Daily Fibonacci 61.8% | 69.07 |
| Daily Pivot Point S1 | 67.31 |
| Daily Pivot Point S2 | 65.33 |
| Daily Pivot Point S3 | 63.78 |
| Daily Pivot Point R1 | 70.84 |
| Daily Pivot Point R2 | 72.39 |
| Daily Pivot Point R3 | 74.37 |
[/s2If]
Join Our Telegram Group
")


