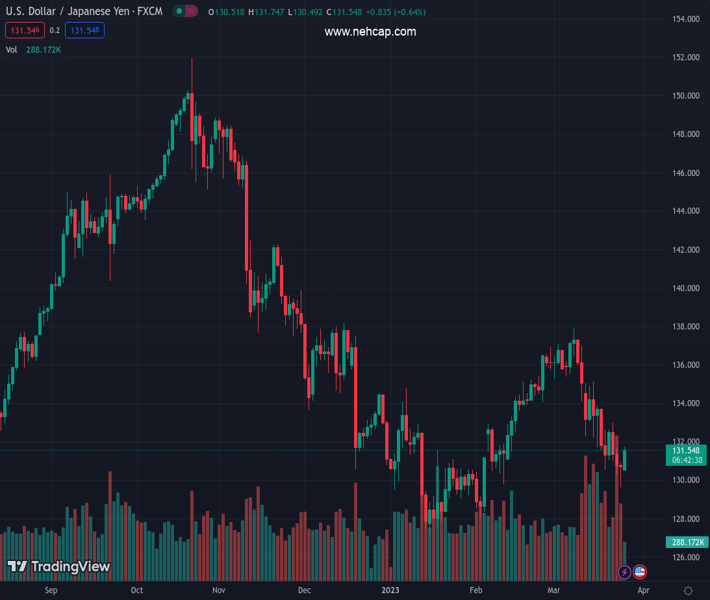
#USDJPY @ 131.588 gains strong positive traction on Monday and recovers further from a multi-week high. (Pivot Orderbook analysis)
…
This is a premium post.
[s2If !current_user_can(access_s2member_level4)]Please register for PREMIUM VERSION HERE to read full post below containing analysis. In case of any error or you think you are not able to read the full post below, please email us at support#nehcap.com [lwa][/s2If] [s2If current_user_can(access_s2member_level4)]
- USD/JPY gains strong positive traction on Monday and recovers further from a multi-week high.
- A combination of factors weighs heavily on the JPY and remains supportive of the momentum.
- The Fed’s less hawkish outlook keeps the USD bulls on the defensive and could cap the upside.
The pair currently trades last at 131.588.
The previous day high was 130.94 while the previous day low was 129.64. The daily 38.2% Fib levels comes at 130.14, expected to provide support. Similarly, the daily 61.8% fib level is at 130.45, expected to provide support.
The USD/JPY pair builds on Friday’s goodish rebound from the 129.65 region, or its lowest level since February 03 and kicks off the new week on a positive note. The steady intraday move-up remains uninterrupted through the early North American session and lifts spot prices to a fresh daily peak, around the 131.75 region in the last hour.
The risk-on impulse undermines the safe-haven Japanese Yen (JPY), which is further weighed down by the widening of the US-Japan rate differential amid a strong rally in the US Treasury bond yields. That said, the Federal Reserve’s less hawkish outlook fails to assist the US Dollar (USD) to capitalize on its recent recovery from a multi-week low and might keep a lid on any further gains for the USD/JPY pair, at least for the time being.
The intraday move up, meanwhile, pushes spot prices beyond the 100-hour Simple Moving Average (SMA), though lacks follow-through beyond the 23.6% Fibonacci retracement level of the recent downfall from the monthly peak. Moreover, oscillators on the daily chart – though they have been recovering from lower levels – are still far from being in positive territory and warrant some caution before placing bullish bets around the USD/JPY pair.
Hence, any subsequent move up is more likely to confront stiff resistance around the 200-hour SMA, currently pegged just ahead of the 132.00 round figure. Some follow-through buying, however, might prompt a short-covering rally and push the USD/JPY pair towards the 132.80-132.85 region, representing the 38.2% Fibo. level. This is closely followed by the 133.00 mark, which if cleared will suggest that spot prices have formed a near-term bottom.
On the flip side, an intraday pullback now seems to find decent support near the 131.00 round-figure mark. The said handle should now act as a pivotal point, which if broken decisively could accelerate the fall towards the 130.55-130.50 intermediate support. The USD/JPY pair could decline further towards the 130.00 psychological mark before eventually dropping back to the multi-week low, around the 129.65 area touched on Friday.
Technical Levels: Supports and Resistances
USDJPY currently trading at 131.49 at the time of writing. Pair opened at 130.72 and is trading with a change of 0.59 % .
| Overview | Overview.1 | |
|---|---|---|
| 0 | Today last price | 131.49 |
| 1 | Today Daily Change | 0.77 |
| 2 | Today Daily Change % | 0.59 |
| 3 | Today daily open | 130.72 |
The pair remains strongly bearish on the daily time frame. It trades below the 20 SMA @ 134.28, 50 SMA 132.6, 100 SMA @ 134.45 and 200 SMA @ 137.41.
| Trends | Trends.1 | |
|---|---|---|
| 0 | Daily SMA20 | 134.28 |
| 1 | Daily SMA50 | 132.60 |
| 2 | Daily SMA100 | 134.45 |
| 3 | Daily SMA200 | 137.41 |
The previous day high was 130.94 while the previous day low was 129.64. The daily 38.2% Fib levels comes at 130.14, expected to provide support. Similarly, the daily 61.8% fib level is at 130.45, expected to provide support.
Note the levels of interest below:
- Pivot support is noted at 129.92, 129.13, 128.62
- Pivot resistance is noted at 131.23, 131.74, 132.53
| Levels | Levels.1 |
|---|---|
| Previous Daily High | 130.94 |
| Previous Daily Low | 129.64 |
| Previous Weekly High | 133.00 |
| Previous Weekly Low | 129.64 |
| Previous Monthly High | 136.92 |
| Previous Monthly Low | 128.08 |
| Daily Fibonacci 38.2% | 130.14 |
| Daily Fibonacci 61.8% | 130.45 |
| Daily Pivot Point S1 | 129.92 |
| Daily Pivot Point S2 | 129.13 |
| Daily Pivot Point S3 | 128.62 |
| Daily Pivot Point R1 | 131.23 |
| Daily Pivot Point R2 | 131.74 |
| Daily Pivot Point R3 | 132.53 |
[/s2If]
Join Our Telegram Group
")


