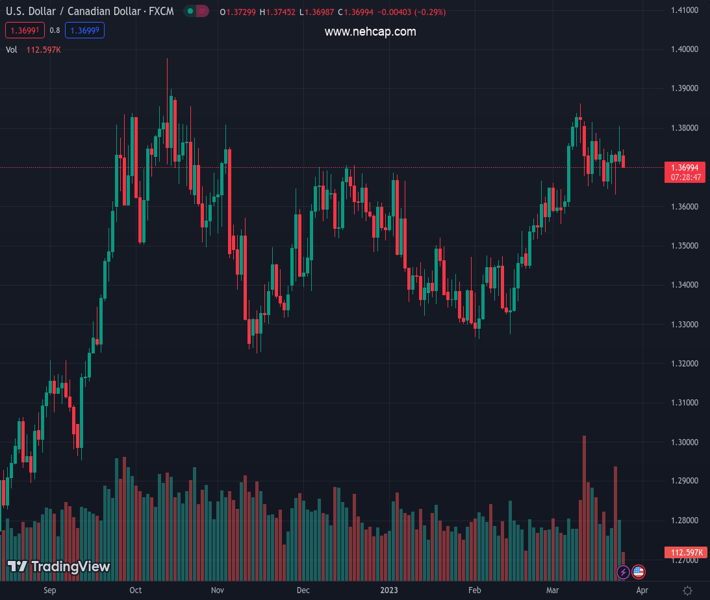
#USDCAD @ 1.37003 edges lower on Monday and is weighed down by a combination of factors. (Pivot Orderbook analysis)
…
This is a premium post.
[s2If !current_user_can(access_s2member_level4)]Please register for PREMIUM VERSION HERE to read full post below containing analysis. In case of any error or you think you are not able to read the full post below, please email us at support#nehcap.com [lwa][/s2If] [s2If current_user_can(access_s2member_level4)]
- USD/CAD edges lower on Monday and is weighed down by a combination of factors.
- An uptick in Oil prices underpins the Loonie and exerts pressure amid a softer USD.
- Rallying US bond yields acts as a tailwind for the buck and should any further losses.
The pair currently trades last at 1.37003.
The previous day high was 1.3804 while the previous day low was 1.3708. The daily 38.2% Fib levels comes at 1.3767, expected to provide resistance. Similarly, the daily 61.8% fib level is at 1.3745, expected to provide resistance.
The USD/CAD pair comes under some selling pressure following a brief intraday consolidation on Monday and drops to a fresh daily low, around the 1.3700 mark heading into the North American session. The intraday downtick drags spot prices away from the 1.3800 round figure, or over a one-week high touched on Friday and is sponsored by a combination of factors.
Crude Oil prices edge higher on the first day of a new week amid expectations that a demand recovery in China and lower Russian production will tighten global supply. This, in turn, underpins the commodity-linked Loonie, which, along with subdued US Dollar (USD) demand, exerts some downward pressure on the USD/CAD pair. The risk-on impulse – as depicted by a positive tone around the equity markets – is seen as a key factor acting as a headwind for the safe-haven buck
Investors breathe a sigh of relief in reaction to the news that First Citizens Bank & Trust Company will buy all of Silicon Valley Bank’s deposits and loans from the Federal Deposit Insurance Corporation (FDIC). Moreover, reports that US authorities were in the early stage of deliberation about expanding emergency lending facilities further boosted investors’ confidence. Apart from this, the Federal Reserve’s signal last week that it might soon pause the rate-hiking cycle weighed on the Greenback.
It is worth recalling that the US central bank raised interest rates by 25 bps on Wednesday, as was widely anticipated, though sounded cautious on outlook. That said, a strong follow-through rally in the US Treasury bond yields, bolstered by easing fears of a full-blown banking crisis, helps limit the downside for the USD and should lend some support to the USD/CAD pair. This, in turn, warrants some caution for aggressive bearish traders and before positioning for further intraday losses.
There isn’t any major market-moving economic data due for release on Monday, either from the US or Canada. That said, the US bond yields and the broader risk sentiment might still influence the USD. Apart from this, traders will take cues from Oil price dynamics to grab short-term opportunities around the USD/CAD pair. The focus, meanwhile, remains on this week’s important US macro data – the Conference Board’s Consumer Confidence Index on Tuesday, followed by the final GDP print on Wednesday and the Fed’s preferred inflation gauge – the US Core PCE Price Index on Friday.
Technical Levels: Supports and Resistances
USDCAD currently trading at 1.3703 at the time of writing. Pair opened at 1.3743 and is trading with a change of -0.29 % .
| Overview | Overview.1 | |
|---|---|---|
| 0 | Today last price | 1.3703 |
| 1 | Today Daily Change | -0.0040 |
| 2 | Today Daily Change % | -0.2900 |
| 3 | Today daily open | 1.3743 |
The pair remains strongly bullish on the daily timeframe. It trades above its 20 SMA @ 1.3702, 50 SMA 1.3529, 100 SMA @ 1.3513 and 200 SMA @ 1.3359.
| Trends | Trends.1 | |
|---|---|---|
| 0 | Daily SMA20 | 1.3702 |
| 1 | Daily SMA50 | 1.3529 |
| 2 | Daily SMA100 | 1.3513 |
| 3 | Daily SMA200 | 1.3359 |
The previous day high was 1.3804 while the previous day low was 1.3708. The daily 38.2% Fib levels comes at 1.3767, expected to provide resistance. Similarly, the daily 61.8% fib level is at 1.3745, expected to provide resistance.
Note the levels of interest below:
- Pivot support is noted at 1.3699, 1.3655, 1.3602
- Pivot resistance is noted at 1.3796, 1.3849, 1.3893
| Levels | Levels.1 |
|---|---|
| Previous Daily High | 1.3804 |
| Previous Daily Low | 1.3708 |
| Previous Weekly High | 1.3804 |
| Previous Weekly Low | 1.3631 |
| Previous Monthly High | 1.3666 |
| Previous Monthly Low | 1.3262 |
| Daily Fibonacci 38.2% | 1.3767 |
| Daily Fibonacci 61.8% | 1.3745 |
| Daily Pivot Point S1 | 1.3699 |
| Daily Pivot Point S2 | 1.3655 |
| Daily Pivot Point S3 | 1.3602 |
| Daily Pivot Point R1 | 1.3796 |
| Daily Pivot Point R2 | 1.3849 |
| Daily Pivot Point R3 | 1.3893 |
[/s2If]
Join Our Telegram Group
")


