#USDCAD @ 1.36644 seesaws around intraday low after falling the most in two weeks the previous day., @nehcap view: Limited downside expected (Pivot Orderbook analysis)
…
This is a premium post.
[s2If !current_user_can(access_s2member_level4)]Please register for PREMIUM VERSION HERE to read full post below containing analysis. In case of any error or you think you are not able to read the full post below, please email us at support#nehcap.com [lwa][/s2If] [s2If current_user_can(access_s2member_level4)]
- USD/CAD seesaws around intraday low after falling the most in two weeks the previous day.
- One-month-old ascending support line restricts immediate downside; 200-EMA is the key hurdle for Loonie pair bears.
- Downbeat oscillators add strength to the bearish bias.
- Recovery needs validation from 1.3815 to convince the bulls.
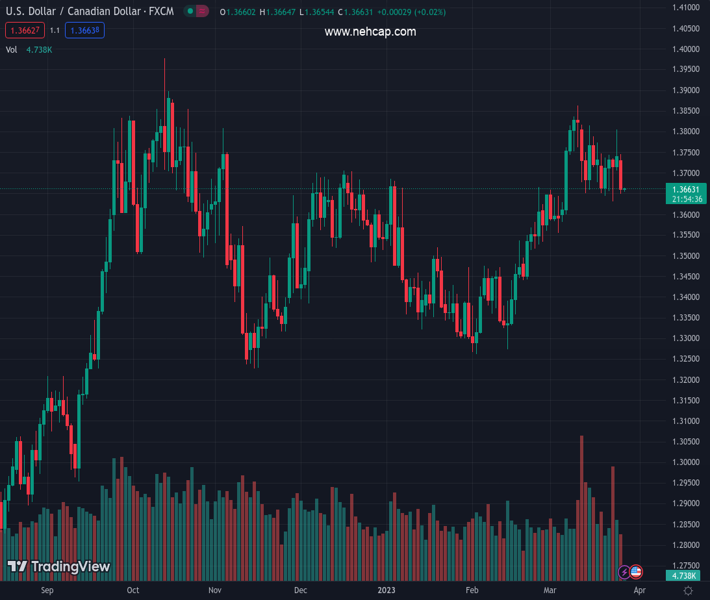
The pair currently trades last at 1.36644.
The previous day high was 1.3804 while the previous day low was 1.3708. The daily 38.2% Fib levels comes at 1.3767, expected to provide resistance. Similarly, the daily 61.8% fib level is at 1.3745, expected to provide resistance.
USD/CAD bears take a breather around 1.3660 during the early Asian session, following the biggest daily loss in a fortnight. In doing so, the Loonie pair seesaws around the key short-term support, as well as floats above the 1.3630 support confluence.
USD/CAD pair’s weakness gains support from the bearish MACD signals and downbeat RSI (14) line, not oversold. However, upward-sloping support from late February, around 1.3650 at the latest, restricts immediate declines of the quote.
Following that, a convergence of the 200-bar Exponential Moving Average (EMA) joins the 38.2% Fibonacci retracement level of the pair’s February-March upside, near 1.3630, appears a tough nut to crack for the USD/CAD bears to crack.
Should the quote remains bearish past 1.3630, the odds of witnessing a slump toward the 50% Fibonacci retracement surrounding 1.3560 can’t be ruled out.
Meanwhile, recovery moves may initially aim to regain the 1.3700 round figure before challenging the latest tops surrounding 1.3750 and 1.3800.
However, a three-week-long horizontal resistance around 1.3815-20 holds the key to the USD/CAD bull’s conviction.
Overall, USD/CAD is likely to decline further but the downside needs validation from 1.3630.
Trend: Limited downside expected
Technical Levels: Supports and Resistances
USDCAD currently trading at 1.3662 at the time of writing. Pair opened at 1.3743 and is trading with a change of -0.59% % .
| Overview | Overview.1 | |
|---|---|---|
| 0 | Today last price | 1.3662 |
| 1 | Today Daily Change | -0.0081 |
| 2 | Today Daily Change % | -0.59% |
| 3 | Today daily open | 1.3743 |
The pair is trading below its 20 Daily moving average @ 1.3702, above its 50 Daily moving average @ 1.3529 , above its 100 Daily moving average @ 1.3513 and above its 200 Daily moving average @ 1.3359
| Trends | Trends.1 | |
|---|---|---|
| 0 | Daily SMA20 | 1.3702 |
| 1 | Daily SMA50 | 1.3529 |
| 2 | Daily SMA100 | 1.3513 |
| 3 | Daily SMA200 | 1.3359 |
The previous day high was 1.3804 while the previous day low was 1.3708. The daily 38.2% Fib levels comes at 1.3767, expected to provide resistance. Similarly, the daily 61.8% fib level is at 1.3745, expected to provide resistance.
Note the levels of interest below:
- Pivot support is noted at 1.3699, 1.3655, 1.3602
- Pivot resistance is noted at 1.3796, 1.3849, 1.3893
| Levels | Levels.1 |
|---|---|
| Previous Daily High | 1.3804 |
| Previous Daily Low | 1.3708 |
| Previous Weekly High | 1.3804 |
| Previous Weekly Low | 1.3631 |
| Previous Monthly High | 1.3666 |
| Previous Monthly Low | 1.3262 |
| Daily Fibonacci 38.2% | 1.3767 |
| Daily Fibonacci 61.8% | 1.3745 |
| Daily Pivot Point S1 | 1.3699 |
| Daily Pivot Point S2 | 1.3655 |
| Daily Pivot Point S3 | 1.3602 |
| Daily Pivot Point R1 | 1.3796 |
| Daily Pivot Point R2 | 1.3849 |
| Daily Pivot Point R3 | 1.3893 |
[/s2If]
Join Our Telegram Group
")


