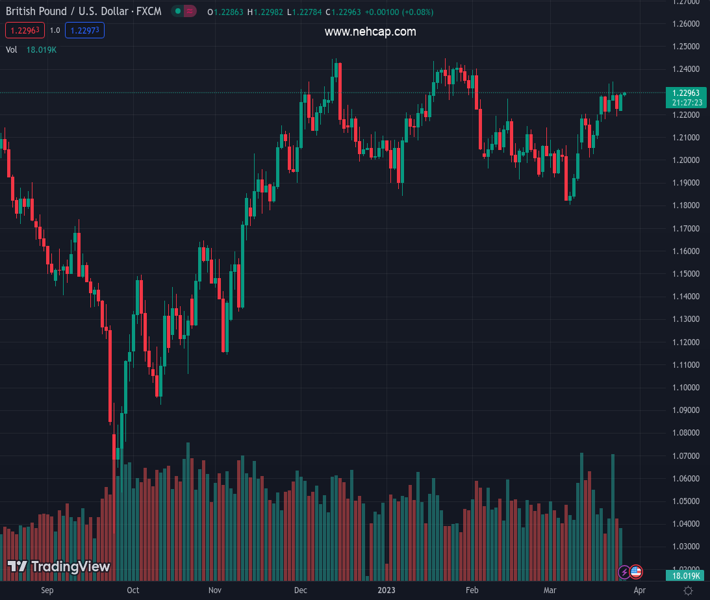
#GBPUSD @ 1.22970 picks up bids to extend week-start recovery moves from short-term key support., @nehcap view: Further upside expected (Pivot Orderbook analysis)
…
This is a premium post.
[s2If !current_user_can(access_s2member_level4)]Please register for PREMIUM VERSION HERE to read full post below containing analysis. In case of any error or you think you are not able to read the full post below, please email us at support#nehcap.com [lwa][/s2If] [s2If current_user_can(access_s2member_level4)]
- GBP/USD picks up bids to extend week-start recovery moves from short-term key support.
- 50-SMA, 61.8% Fibonacci retracement level challenge bears amid looming bull cross on the MACD.
- Rising wedge confirmation keeps Cable sellers hopeful unless the quote stays below 1.2330 previous support.
The pair currently trades last at 1.22970.
The previous day high was 1.2292 while the previous day low was 1.2191. The daily 38.2% Fib levels comes at 1.223, expected to provide support. Similarly, the daily 61.8% fib level is at 1.2253, expected to provide support.
GBP/USD remains on the front foot as bulls attack the 1.2300 mark during Tuesday’s Asian session, following an upbeat start of the week.
In doing so, the Cable pair stretches the previous run-up from the 50-bar Simple Moving Average (SMA) and the 61.8% Fibonacci retracement level of the quote’s January-March downside. Adding strength to the upside bias could be the impending bulls cross on the MACD.
However, the previous week’s confirmation of the rising wedge bearish chart pattern keeps the Cable pair sellers hopeful unless the quote stays below the previous support line of the wedge, near 1.2330 by the press time.
Following that, the stated wedge’s top line near the 1.2400 round figure and multiple hurdles near the 1.2420-25 area can test the GBP/USD pair’s further upside ahead of directing it to the Year-To-Date (YTD) top surrounding 1.2450.
On the flip side, the 50-SMA and the aforementioned key Fibonacci ratio can challenge short-term GBP/USD bears around 1.2220 and 1.2200 respectively.
In a case where the Cable pair remains bearish past 1.2200, the 50% Fibonacci retracement and 200-SMA can test the downside moves around 1.2125 and 1.2080 in that order before directing bears towards the 1.2000 psychological magnet.
It should be noted that multiple supports near 1.1920 act as the last defense of the GBP/USD buyers.
Trend: Further upside expected
Technical Levels: Supports and Resistances
GBPUSD currently trading at 1.2292 at the time of writing. Pair opened at 1.2233 and is trading with a change of 0.48% % .
| Overview | Overview.1 | |
|---|---|---|
| 0 | Today last price | 1.2292 |
| 1 | Today Daily Change | 0.0059 |
| 2 | Today Daily Change % | 0.48% |
| 3 | Today daily open | 1.2233 |
The pair remains strongly bullish on the daily timeframe. It trades above its 20 SMA @ 1.2085, 50 SMA 1.2148, 100 SMA @ 1.2093 and 200 SMA @ 1.1893.
| Trends | Trends.1 | |
|---|---|---|
| 0 | Daily SMA20 | 1.2085 |
| 1 | Daily SMA50 | 1.2148 |
| 2 | Daily SMA100 | 1.2093 |
| 3 | Daily SMA200 | 1.1893 |
The previous day high was 1.2292 while the previous day low was 1.2191. The daily 38.2% Fib levels comes at 1.223, expected to provide support. Similarly, the daily 61.8% fib level is at 1.2253, expected to provide support.
Note the levels of interest below:
- Pivot support is noted at 1.2185, 1.2137, 1.2083
- Pivot resistance is noted at 1.2287, 1.234, 1.2388
| Levels | Levels.1 |
|---|---|
| Previous Daily High | 1.2292 |
| Previous Daily Low | 1.2191 |
| Previous Weekly High | 1.2344 |
| Previous Weekly Low | 1.2167 |
| Previous Monthly High | 1.2402 |
| Previous Monthly Low | 1.1915 |
| Daily Fibonacci 38.2% | 1.2230 |
| Daily Fibonacci 61.8% | 1.2253 |
| Daily Pivot Point S1 | 1.2185 |
| Daily Pivot Point S2 | 1.2137 |
| Daily Pivot Point S3 | 1.2083 |
| Daily Pivot Point R1 | 1.2287 |
| Daily Pivot Point R2 | 1.2340 |
| Daily Pivot Point R3 | 1.2388 |
[/s2If]
Join Our Telegram Group
")


