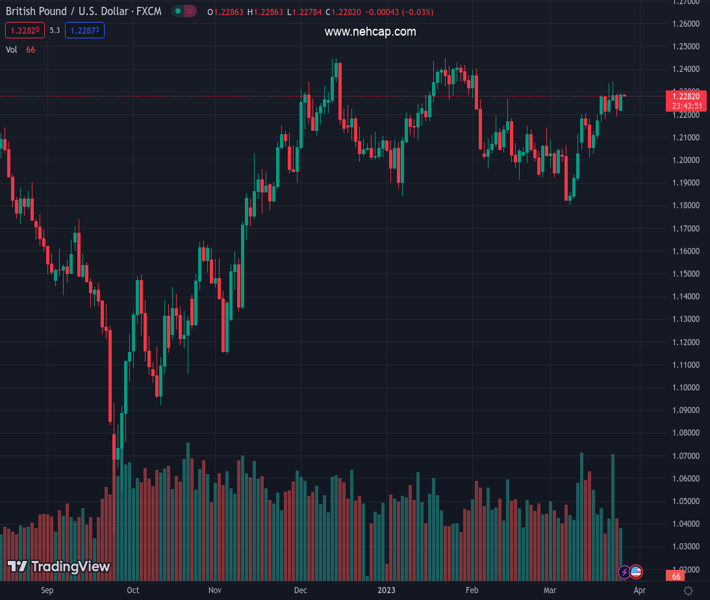
#GBPUSD @ 1.22832 stalls on the bid and moves into consolidation. (Pivot Orderbook analysis)
…
This is a premium post.
[s2If !current_user_can(access_s2member_level4)]Please register for PREMIUM VERSION HERE to read full post below containing analysis. In case of any error or you think you are not able to read the full post below, please email us at support#nehcap.com [lwa][/s2If] [s2If current_user_can(access_s2member_level4)]
- GBP/USD stalls on the bid and moves into consolidation.
- Investors seek clarity on the fallout from the recent collapse of two US lenders and Credit Suisse recue.
The pair currently trades last at 1.22832.
The previous day high was 1.2292 while the previous day low was 1.2191. The daily 38.2% Fib levels comes at 1.223, expected to provide support. Similarly, the daily 61.8% fib level is at 1.2253, expected to provide support.
GBP/USD climbed to 1.2293 from a low of 1.2218 while the US dollar was weighed within a narrow range against most major currencies while traders sought clarity on the fallout from the recent collapse of two US lenders and the rescue of Credit Suisse.
Data released earlier Monday showed that UK Retail Sales conditions from the Confederation of British Industry declined modestly in March and BoE Governor Andrew Bailey spoke and said that the central bank has to be very alert to any signs of persistent inflationary pressures.
Elsewhere, Minneapolis Federal Reserve’s president, Neel Kashkari, warned the US is on the brink of a recession. As for US data, the Dallas Fed Manufacturing Activity Index dropped to -15.7pts in March as perceptions of broader business conditions worsened. The company outlook subindex rose four points to -13.3.
Analysts at ANZ Bank noted that ´´the outlook uncertainty subindex came in at 22.0, down slightly from February but still high. Labour market measures remained positive, with 24% of firms net hiring, while 14% reported net layoffs. Price and wage pressures receded in March.´´
Technical Levels: Supports and Resistances
GBPUSD currently trading at 1.2287 at the time of writing. Pair opened at 1.2233 and is trading with a change of 0.44 % .
| Overview | Overview.1 | |
|---|---|---|
| 0 | Today last price | 1.2287 |
| 1 | Today Daily Change | 0.0054 |
| 2 | Today Daily Change % | 0.4400 |
| 3 | Today daily open | 1.2233 |
The pair remains strongly bullish on the daily timeframe. It trades above its 20 SMA @ 1.2085, 50 SMA 1.2148, 100 SMA @ 1.2093 and 200 SMA @ 1.1893.
| Trends | Trends.1 | |
|---|---|---|
| 0 | Daily SMA20 | 1.2085 |
| 1 | Daily SMA50 | 1.2148 |
| 2 | Daily SMA100 | 1.2093 |
| 3 | Daily SMA200 | 1.1893 |
The previous day high was 1.2292 while the previous day low was 1.2191. The daily 38.2% Fib levels comes at 1.223, expected to provide support. Similarly, the daily 61.8% fib level is at 1.2253, expected to provide support.
Note the levels of interest below:
- Pivot support is noted at 1.2185, 1.2137, 1.2083
- Pivot resistance is noted at 1.2287, 1.234, 1.2388
| Levels | Levels.1 |
|---|---|
| Previous Daily High | 1.2292 |
| Previous Daily Low | 1.2191 |
| Previous Weekly High | 1.2344 |
| Previous Weekly Low | 1.2167 |
| Previous Monthly High | 1.2402 |
| Previous Monthly Low | 1.1915 |
| Daily Fibonacci 38.2% | 1.2230 |
| Daily Fibonacci 61.8% | 1.2253 |
| Daily Pivot Point S1 | 1.2185 |
| Daily Pivot Point S2 | 1.2137 |
| Daily Pivot Point S3 | 1.2083 |
| Daily Pivot Point R1 | 1.2287 |
| Daily Pivot Point R2 | 1.2340 |
| Daily Pivot Point R3 | 1.2388 |
[/s2If]
Join Our Telegram Group
")


