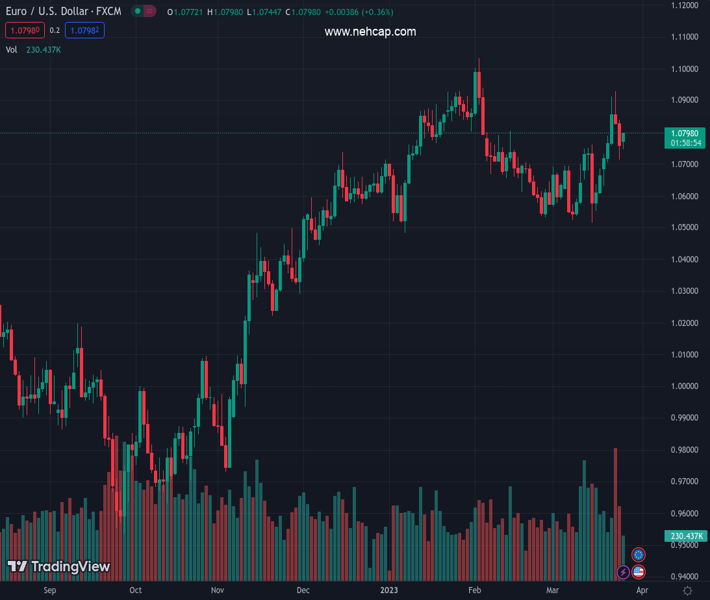
#EURUSD @ 1.07954 Despite high US T-bond yields, rebounds after two consecutive days of losses. (Pivot Orderbook analysis)
…
This is a premium post.
[s2If !current_user_can(access_s2member_level4)]Please register for PREMIUM VERSION HERE to read full post below containing analysis. In case of any error or you think you are not able to read the full post below, please email us at support#nehcap.com [lwa][/s2If] [s2If current_user_can(access_s2member_level4)]
- Despite high US T-bond yields, EUR/USD rebounds after two consecutive days of losses.
- A risk-on impulse underpinned the Euro to the detriment of the US Dollar.
- EUR/USD Price Analysis: Triple bottom pattern remains in play as long as EUR/USD stays above 1.0759
The pair currently trades last at 1.07954.
The previous day high was 1.0839 while the previous day low was 1.0714. The daily 38.2% Fib levels comes at 1.0762, expected to provide support. Similarly, the daily 61.8% fib level is at 1.0791, expected to provide support.
EUR/USD snaps two straight days of losses and climbs after hitting a daily low of 1.0744 amidst a subdued session. Despite high US Treasury bond yields, risk-appetite improvement and a softer US Dollar (USD) opened the door for further Euro (EUR) upside. At the time of writing, the EUR/USD is trading at 1.0789 above its opening price.
US equity markets are mixed, with the Dow Jones and the S&P 500 rising while the Nasdaq tumbles. Market participants cheered First Citizens BancShare’s takeover of the Silicon Valley Bank (SVB), while US authorities are considering expanding emergency lending facilities to First Republic Bank.
Data-wise, the March US Dallas Fed Manufacturing Index plunged -15.7, more than February’s -13.5 collapse and worse than the -10.9 estimate. Delving into the data, the Production Index and the Employment component rose. New Orders declined, and the Price Index fell from 15.5 to 7.0.
US Treasury bond yields recovered, with 2s meandering around 4%, while the 10-year benchmark note rate sits at 3.515%, gaining thirteen basis points. The greenback has failed to capitalize on the US bond yields rise, with the US Dollar Index (DXY) sliding 0.19% at 102.915.
On the Eurozone (EU) front, European Central Bank (ECB) speakers are crossing the wires. Nagel acknowledged the increasing importance of taking a meeting-by-meeting approach, though he emphasized that the path of monetary policy normalization would continue. He added that QT would accelerate soon. On the flip side, ECB’s de Cos took a cautious approach due to high levels of uncertainty in the financial markets.
Of late, ECB’s board member Isabel Schnabel commented that she wanted to signal that further rate hikes were possible, according to people who know the matter.
Technically speaking, the EUR/USD is neutral to upward biased, with a triple bottom staying in play as long as the EUR/USD remains above 1.0759. Oscillators are giving mixed signals. The Relative Strength Index (RSI) favors EUR/USD upside, while the Rate of Chance (RoC) suggests that buying pressure is waning. The path of least resistance is upwards; therefore, the EUR/USD first resistance would be 1.0800. Once broken, the EUR/USD’s next ceiling would be 1.0929, followed by the 1.1000 figure.
Technical Levels: Supports and Resistances
EURUSD currently trading at 1.0793 at the time of writing. Pair opened at 1.076 and is trading with a change of 0.31 % .
| Overview | Overview.1 | |
|---|---|---|
| 0 | Today last price | 1.0793 |
| 1 | Today Daily Change | 0.0033 |
| 2 | Today Daily Change % | 0.3100 |
| 3 | Today daily open | 1.0760 |
The pair remains strongly bullish on the daily timeframe. It trades above its 20 SMA @ 1.0666, 50 SMA 1.0729, 100 SMA @ 1.0615 and 200 SMA @ 1.0334.
| Trends | Trends.1 | |
|---|---|---|
| 0 | Daily SMA20 | 1.0666 |
| 1 | Daily SMA50 | 1.0729 |
| 2 | Daily SMA100 | 1.0615 |
| 3 | Daily SMA200 | 1.0334 |
The previous day high was 1.0839 while the previous day low was 1.0714. The daily 38.2% Fib levels comes at 1.0762, expected to provide support. Similarly, the daily 61.8% fib level is at 1.0791, expected to provide support.
Note the levels of interest below:
- Pivot support is noted at 1.0702, 1.0645, 1.0577
- Pivot resistance is noted at 1.0828, 1.0896, 1.0953
| Levels | Levels.1 |
|---|---|
| Previous Daily High | 1.0839 |
| Previous Daily Low | 1.0714 |
| Previous Weekly High | 1.0930 |
| Previous Weekly Low | 1.0631 |
| Previous Monthly High | 1.1033 |
| Previous Monthly Low | 1.0533 |
| Daily Fibonacci 38.2% | 1.0762 |
| Daily Fibonacci 61.8% | 1.0791 |
| Daily Pivot Point S1 | 1.0702 |
| Daily Pivot Point S2 | 1.0645 |
| Daily Pivot Point S3 | 1.0577 |
| Daily Pivot Point R1 | 1.0828 |
| Daily Pivot Point R2 | 1.0896 |
| Daily Pivot Point R3 | 1.0953 |
[/s2If]
Join Our Telegram Group
")


