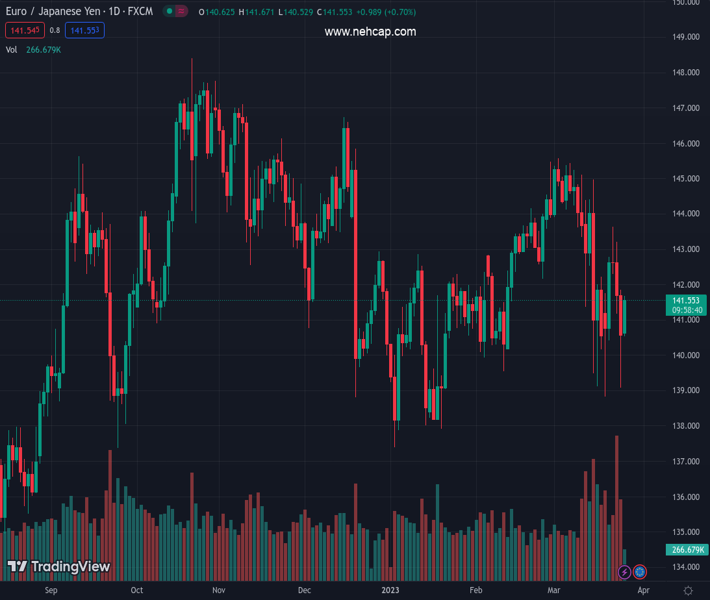
#EURJPY @ 141.562 leaves behind three consecutive daily pullbacks on Monday. (Pivot Orderbook analysis)
…
This is a premium post.
[s2If !current_user_can(access_s2member_level4)]Please register for PREMIUM VERSION HERE to read full post below containing analysis. In case of any error or you think you are not able to read the full post below, please email us at support#nehcap.com [lwa][/s2If] [s2If current_user_can(access_s2member_level4)]
- EUR/JPY leaves behind three consecutive daily pullbacks on Monday.
- Extra range bound trade should remain on the cards for the time being.
The pair currently trades last at 141.562.
The previous day high was 141.85 while the previous day low was 139.07. The daily 38.2% Fib levels comes at 140.13, expected to provide support. Similarly, the daily 61.8% fib level is at 140.79, expected to provide support.
EUR/JPY bounces off Friday’s weekly lows and retakes the 141.00 barrier and above at the beginning of the week.
The cross now flirts with the key 200-day SMA near 141.80, and a sustainable surpass of this region should open the door to further upside in the short-term horizon. Moving forward, the consolidation theme is expected to remain unchanged as long as the March peaks around 145.50 continue to cap the upside.
In the meantime, extra losses remain in store while the cross trades below the 200-day SMA.
Technical Levels: Supports and Resistances
EURJPY currently trading at 141.57 at the time of writing. Pair opened at 140.64 and is trading with a change of 0.66 % .
| Overview | Overview.1 | |
|---|---|---|
| 0 | Today last price | 141.57 |
| 1 | Today Daily Change | 115.00 |
| 2 | Today Daily Change % | 0.66 |
| 3 | Today daily open | 140.64 |
The pair remains strongly bearish on the daily time frame. It trades below the 20 SMA @ 143.22, 50 SMA 142.24, 100 SMA @ 142.66 and 200 SMA @ 141.84.
| Trends | Trends.1 | |
|---|---|---|
| 0 | Daily SMA20 | 143.22 |
| 1 | Daily SMA50 | 142.24 |
| 2 | Daily SMA100 | 142.66 |
| 3 | Daily SMA200 | 141.84 |
The previous day high was 141.85 while the previous day low was 139.07. The daily 38.2% Fib levels comes at 140.13, expected to provide support. Similarly, the daily 61.8% fib level is at 140.79, expected to provide support.
Note the levels of interest below:
- Pivot support is noted at 139.19, 137.74, 136.41
- Pivot resistance is noted at 141.97, 143.3, 144.74
| Levels | Levels.1 |
|---|---|
| Previous Daily High | 141.85 |
| Previous Daily Low | 139.07 |
| Previous Weekly High | 143.63 |
| Previous Weekly Low | 138.83 |
| Previous Monthly High | 145.47 |
| Previous Monthly Low | 139.55 |
| Daily Fibonacci 38.2% | 140.13 |
| Daily Fibonacci 61.8% | 140.79 |
| Daily Pivot Point S1 | 139.19 |
| Daily Pivot Point S2 | 137.74 |
| Daily Pivot Point S3 | 136.41 |
| Daily Pivot Point R1 | 141.97 |
| Daily Pivot Point R2 | 143.30 |
| Daily Pivot Point R3 | 144.74 |
[/s2If]
Join Our Telegram Group
")


