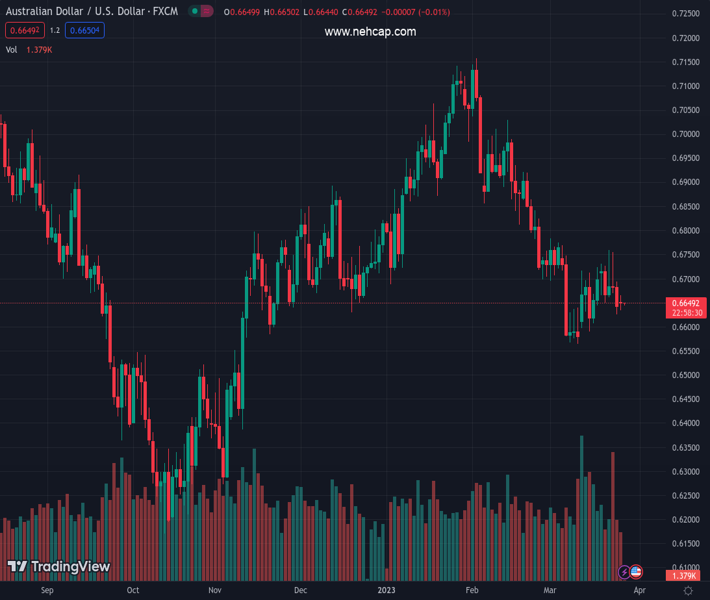
#AUDUSD @ 0.66490 is continuously oscillating below 0.6660 as the focus has shifted to Australian Retail Sales and CPI data. (Pivot Orderbook analysis)
…
This is a premium post.
[s2If !current_user_can(access_s2member_level4)]Please register for PREMIUM VERSION HERE to read full post below containing analysis. In case of any error or you think you are not able to read the full post below, please email us at support#nehcap.com [lwa][/s2If] [s2If current_user_can(access_s2member_level4)]
- AUD/USD is continuously oscillating below 0.6660 as the focus has shifted to Australian Retail Sales and CPI data.
- Tuesday’s Retail Sales (Feb) data is expected to expand by 0.4% lower than the former expansion of 1.9%.
- The USD Index has corrected to near 102.83 as the Fed would terminate its rate-hiking spell sooner.
The pair currently trades last at 0.66490.
The previous day high was 0.6694 while the previous day low was 0.6625. The daily 38.2% Fib levels comes at 0.6652, expected to provide resistance. Similarly, the daily 61.8% fib level is at 0.6668, expected to provide resistance.
The AUD/USD pair is demonstrating a back-and-forth action below 0.6660 from Friday’s session. The sideways performance in the Aussie asset is expected to conclude and a power-pack action will be witnessed. Sheer volatility is expected in the Australian Dollar after the release of Tuesday’s Retail Sales and Wednesday’s Consumer Price Index (CPI) data.
Tuesday’s Retail Sales (Feb) data is expected to expand by 0.4% lower than the former expansion of 1.9%. The Reserve Bank of Australia (RBA) is extremely worried about persistent inflation in the Australian economy and a softening retail demand would provide some relief to policymakers.
However, the important catalyst is the monthly CPI data, which is likely to ease to 7.1% from the former release of 7.4%. RBA policymakers have already stated that there is evidence that indicates that Australian inflation has started easing. And, the RBA could terminate its policy-tightening process from April’s monetary meeting as the current monetary policy is restrictive enough to tame the stubborn inflation.
Meanwhile, S&P500 settled Monday’s trading session with decent gains on hopes that the United States banking system will be bailed out as US authorities are making significant efforts by expanding liquidity assistance, portraying a solid risk appetite theme.
The US Dollar Index (DXY) has corrected gradually to near 102.83 as the market participants are split about guidance on interest rates. As per the CME Fedwatch tool, more than 50% of investors are advocating for the maintenance of a status quo by the Federal Reserve (Fed) in its May monetary policy meeting as tight credit conditions approach by US banks would actively weigh on US inflation.
Technical Levels: Supports and Resistances
AUDUSD currently trading at 0.6648 at the time of writing. Pair opened at 0.6644 and is trading with a change of 0.06 % .
| Overview | Overview.1 | |
|---|---|---|
| 0 | Today last price | 0.6648 |
| 1 | Today Daily Change | 0.0004 |
| 2 | Today Daily Change % | 0.0600 |
| 3 | Today daily open | 0.6644 |
The pair remains strongly bearish on the daily time frame. It trades below the 20 SMA @ 0.6676, 50 SMA 0.6846, 100 SMA @ 0.6793 and 200 SMA @ 0.6758.
| Trends | Trends.1 | |
|---|---|---|
| 0 | Daily SMA20 | 0.6676 |
| 1 | Daily SMA50 | 0.6846 |
| 2 | Daily SMA100 | 0.6793 |
| 3 | Daily SMA200 | 0.6758 |
The previous day high was 0.6694 while the previous day low was 0.6625. The daily 38.2% Fib levels comes at 0.6652, expected to provide resistance. Similarly, the daily 61.8% fib level is at 0.6668, expected to provide resistance.
Note the levels of interest below:
- Pivot support is noted at 0.6615, 0.6585, 0.6546
- Pivot resistance is noted at 0.6684, 0.6724, 0.6753
| Levels | Levels.1 |
|---|---|
| Previous Daily High | 0.6694 |
| Previous Daily Low | 0.6625 |
| Previous Weekly High | 0.6759 |
| Previous Weekly Low | 0.6625 |
| Previous Monthly High | 0.7158 |
| Previous Monthly Low | 0.6698 |
| Daily Fibonacci 38.2% | 0.6652 |
| Daily Fibonacci 61.8% | 0.6668 |
| Daily Pivot Point S1 | 0.6615 |
| Daily Pivot Point S2 | 0.6585 |
| Daily Pivot Point S3 | 0.6546 |
| Daily Pivot Point R1 | 0.6684 |
| Daily Pivot Point R2 | 0.6724 |
| Daily Pivot Point R3 | 0.6753 |
[/s2If]
Join Our Telegram Group
")


