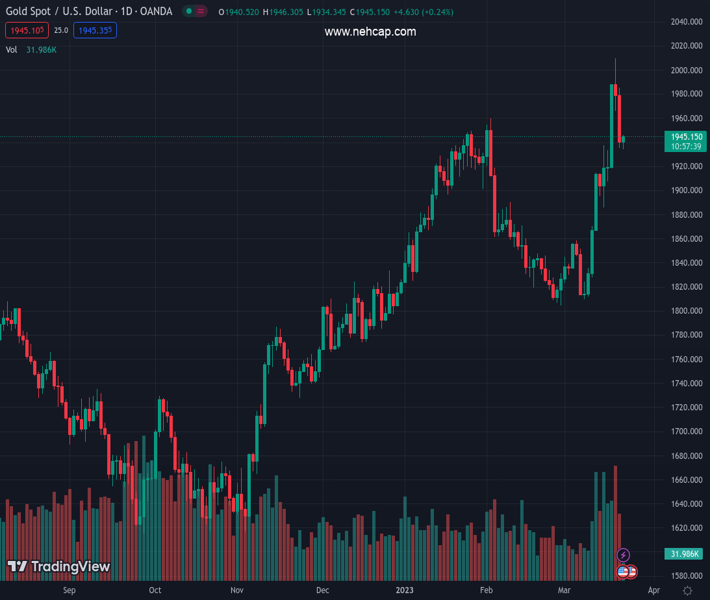
#XAUUSD @ 1,944.23 Gold price reverses an intraday dip to a fresh weekly low, though the upside seems limited. (Pivot Orderbook analysis)
…
This is a premium post.
[s2If !current_user_can(access_s2member_level4)]Please register for PREMIUM VERSION HERE to read full post below containing analysis. In case of any error or you think you are not able to read the full post below, please email us at support#nehcap.com [lwa][/s2If] [s2If current_user_can(access_s2member_level4)]
- Gold price reverses an intraday dip to a fresh weekly low, though the upside seems limited.
- The USD drops to a fresh multi-week low amid bets for a less hawkish Fed and lends support.
- Easing fears of a full-blown banking crisis act as a headwind ahead of the key FOMC decision.
The pair currently trades last at 1944.23.
The previous day high was 1985.25 while the previous day low was 1935.48. The daily 38.2% Fib levels comes at 1954.49, expected to provide resistance. Similarly, the daily 61.8% fib level is at 1966.24, expected to provide resistance.
Gold price struggles for a firm intraday direction on Wednesday and oscillates in a narrow trading band just above the weekly low touched during the early European session. The XAU/USD is currently placed around the $1,941-$1,942 region and for now, seems to have stalled this week’s sharp pullback from levels beyond the $2,000 psychological mark, or a one-year peak.
The US Dollar (USD) drops to its lowest level since February 14 amid expectations that the Federal Reserve (Fed) will soften its hawkish stance. Moreover, the collapse of two mid-size banks in the United States (US) – Silicon Valley Bank and Signature Bank – fueled speculations that the Fed might cut interest rates during the second half of the year. This drags the USD lower for the fourth straight day and turns out to be a key factor lending some support to the US Dollar-denominated Gold price. That said, a combination of factors might keep a lid on any meaningful upside and warrants some caution for bullish traders.
The recent news that UBS will rescue Credit Suisse in a $3.24 billion deal helped calm nerves about the contagion risk and prompted investors to cautiously return to riskier assets. This led to a strong two-day rally in the equity markets, which, in turn, resulted in receding demand for traditional safe-haven assets and should as a headwind for Gold price. Moreover, easing fears of a full-blown banking crisis lifts expectations that the Fed will continue its fight against inflation. In fact, the markets are still pricing in a 25 bps rate hike at the end of a two-day Federal Open Market Committee (FOMC) meeting later this Wednesday.
Furthermore, the stronger consumer inflation figures from the United Kingdom (UK) released this Wednesday add pressure on the Bank of England (BoE) to hike by 25 bps at the very least on Thursday. This, along with the prospects for additional jumbo rate hikes by the European Central Bank (ECB), should cap the non-yielding Gold price. This makes it prudent to wait for a strong follow-through buying before positioning for any further appreciating move. Traders might also prefer to wait for fresh clues about the Fed’s future rate-hike path, which will determine the next leg of a directional move for Gold price.
Hence, the market focus will remain glued to the FOMC monetary policy statement and the updated economic projections, especially the dot plot. Apart from this, investors will closely scrutinize Fed Chair Jerome Powell’s remarks at the post-meeting press conference, which will play a key role in influencing the near-term USD price dynamics. and provide some meaningful impetus to Gold price.
From a technical perspective, any subsequent move up is likely to confront some resistance near the $1.955-$1,960 region. A sustained move beyond has the potential to lift the Gold price to the $1,978-$1,980 zone en route to the key $2,000 round figure and the one-year high, around the $2.010 area touched on Monday. On the flip side, the daily low, around the $1,934 level, seems to protect the immediate downside ahead of the $1,918 horizontal support. A convincing break below will expose the $1,900 mark, which should act as a strong base for the XAU/USD and a pivotal point for short-term traders.
Technical Levels: Supports and Resistances
XAUUSD currently trading at 1945.1 at the time of writing. Pair opened at 1940.24 and is trading with a change of 0.25 % .
| Overview | Overview.1 | |
|---|---|---|
| 0 | Today last price | 1945.10 |
| 1 | Today Daily Change | 4.86 |
| 2 | Today Daily Change % | 0.25 |
| 3 | Today daily open | 1940.24 |
The pair remains strongly bullish on the daily timeframe. It trades above its 20 SMA @ 1868.58, 50 SMA 1883.03, 100 SMA @ 1830.53 and 200 SMA @ 1778.41.
| Trends | Trends.1 | |
|---|---|---|
| 0 | Daily SMA20 | 1868.58 |
| 1 | Daily SMA50 | 1883.03 |
| 2 | Daily SMA100 | 1830.53 |
| 3 | Daily SMA200 | 1778.41 |
The previous day high was 1985.25 while the previous day low was 1935.48. The daily 38.2% Fib levels comes at 1954.49, expected to provide resistance. Similarly, the daily 61.8% fib level is at 1966.24, expected to provide resistance.
Note the levels of interest below:
- Pivot support is noted at 1922.06, 1903.89, 1872.29
- Pivot resistance is noted at 1971.83, 2003.43, 2021.6
| Levels | Levels.1 |
|---|---|
| Previous Daily High | 1985.25 |
| Previous Daily Low | 1935.48 |
| Previous Weekly High | 1989.51 |
| Previous Weekly Low | 1867.66 |
| Previous Monthly High | 1959.80 |
| Previous Monthly Low | 1804.76 |
| Daily Fibonacci 38.2% | 1954.49 |
| Daily Fibonacci 61.8% | 1966.24 |
| Daily Pivot Point S1 | 1922.06 |
| Daily Pivot Point S2 | 1903.89 |
| Daily Pivot Point S3 | 1872.29 |
| Daily Pivot Point R1 | 1971.83 |
| Daily Pivot Point R2 | 2003.43 |
| Daily Pivot Point R3 | 2021.60 |
[/s2If]
Join Our Telegram Group
")


