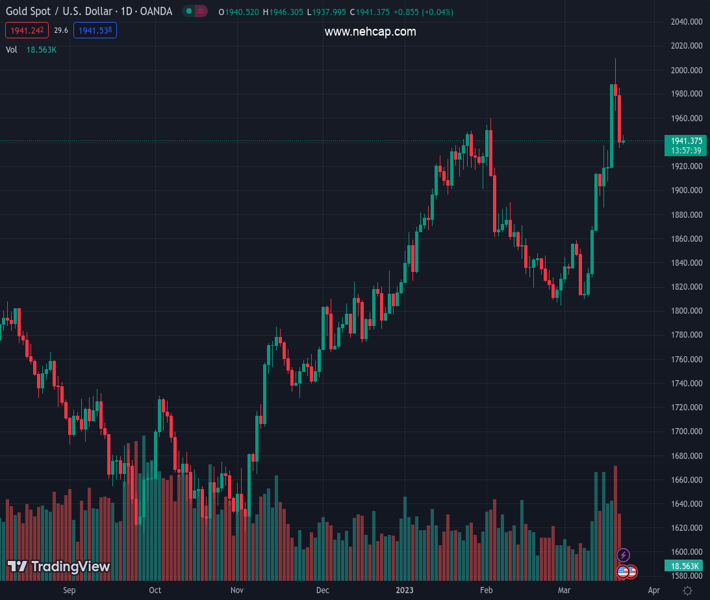
#XAUUSD @ 1,941.13 retraces from $2,000 as US Treasury bond yield surges on Fed’s backstop. (Pivot Orderbook analysis)
…
This is a premium post.
[s2If !current_user_can(access_s2member_level4)]Please register for PREMIUM VERSION HERE to read full post below containing analysis. In case of any error or you think you are not able to read the full post below, please email us at support#nehcap.com [lwa][/s2If] [s2If current_user_can(access_s2member_level4)]
- XAU/USD retraces from $2,000 as US Treasury bond yield surges on Fed’s backstop.
- Gold prices poised for potential volatility amid upcoming Fed meeting.
- Gold price could fall further if the dot plot remains stretched.
The pair currently trades last at 1941.13.
The previous day high was 1985.25 while the previous day low was 1935.48. The daily 38.2% Fib levels comes at 1954.49, expected to provide resistance. Similarly, the daily 61.8% fib level is at 1966.24, expected to provide resistance.
XAU/USD is likely to remain within a narrow range as the market eagerly awaits the Federal Reserve (Fed) rate decision. Gold prices experienced a sharp retracement after reaching the $2,000 mark on Monday, with the decline occurring due to rising US Treasury bond yields.
Gold prices surged to the $2,000 level amid global banking turmoil, prompting investors to flock to US Treasury bonds and causing yields to fall. The precious metal rallied as much as 10%, or about $180, reaching a one-year high as safe-haven demand increased following the collapse of U.S.-based Silicon Valley Bank and a crisis at lender Credit Suisse.
The banking crisis took a turn when US authorities intervened, injecting dollar liquidity into the market. The Fed initially restarted swap lines for needy central banks and opened a discount window for struggling commercial banks. Later, US Treasury Secretary Janet Yellen assured deposit guarantees for all small banks.
These developments somewhat eased investor concerns, leading to increased risk exposure and a positive close for Wall Street on Tuesday.
This has further encouraged investors to consider the possibility of an additional 25 basis point (bps) rate hike from the Fed. As the Fed meeting approaches, it will be crucial to monitor the dot plot and forward guidance. A higher dot plot could reinforce investor expectations of a hawkish repricing, putting further pressure on gold prices.
Traders are advised to exercise extra caution, as this event could lead to various interpretations of policy statements due to the wide polarization among investors. Not all Fed events are the same; some offer clearer price action, while others result in choppy trading. Fed Chair Jerome Powell’s press conference may provide more clarity for investors.
Technical Levels: Supports and Resistances
XAUUSD currently trading at 1942.44 at the time of writing. Pair opened at 1940.24 and is trading with a change of 0.11 % .
| Overview | Overview.1 | |
|---|---|---|
| 0 | Today last price | 1942.44 |
| 1 | Today Daily Change | 2.20 |
| 2 | Today Daily Change % | 0.11 |
| 3 | Today daily open | 1940.24 |
The pair remains strongly bullish on the daily timeframe. It trades above its 20 SMA @ 1868.58, 50 SMA 1883.03, 100 SMA @ 1830.53 and 200 SMA @ 1778.41.
| Trends | Trends.1 | |
|---|---|---|
| 0 | Daily SMA20 | 1868.58 |
| 1 | Daily SMA50 | 1883.03 |
| 2 | Daily SMA100 | 1830.53 |
| 3 | Daily SMA200 | 1778.41 |
The previous day high was 1985.25 while the previous day low was 1935.48. The daily 38.2% Fib levels comes at 1954.49, expected to provide resistance. Similarly, the daily 61.8% fib level is at 1966.24, expected to provide resistance.
Note the levels of interest below:
- Pivot support is noted at 1922.06, 1903.89, 1872.29
- Pivot resistance is noted at 1971.83, 2003.43, 2021.6
| Levels | Levels.1 |
|---|---|
| Previous Daily High | 1985.25 |
| Previous Daily Low | 1935.48 |
| Previous Weekly High | 1989.51 |
| Previous Weekly Low | 1867.66 |
| Previous Monthly High | 1959.80 |
| Previous Monthly Low | 1804.76 |
| Daily Fibonacci 38.2% | 1954.49 |
| Daily Fibonacci 61.8% | 1966.24 |
| Daily Pivot Point S1 | 1922.06 |
| Daily Pivot Point S2 | 1903.89 |
| Daily Pivot Point S3 | 1872.29 |
| Daily Pivot Point R1 | 1971.83 |
| Daily Pivot Point R2 | 2003.43 |
| Daily Pivot Point R3 | 2021.60 |
[/s2If]
Join Our Telegram Group
")


