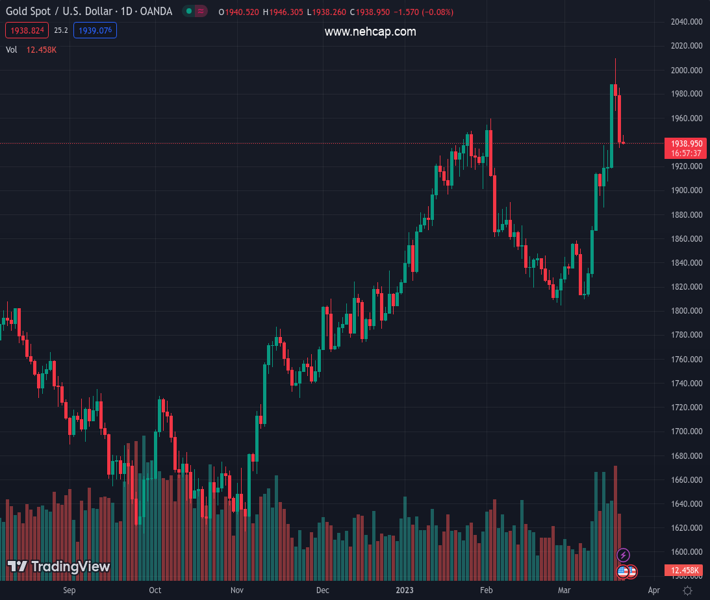
#XAUUSD @ 1,939.31 Gold price is making efforts for maintaining its auction above $1,940.00. (Pivot Orderbook analysis)
…
This is a premium post.
[s2If !current_user_can(access_s2member_level4)]Please register for PREMIUM VERSION HERE to read full post below containing analysis. In case of any error or you think you are not able to read the full post below, please email us at support#nehcap.com [lwa][/s2If] [s2If current_user_can(access_s2member_level4)]
- Gold price is making efforts for maintaining its auction above $1,940.00.
- The recent rally in the Gold price was driven was weakness in the USD Index and fears of a banking sector meltdown.
- The USD Index is showing a subdued performance as odds for a 25bp rate hike by the Fed are accelerating.
The pair currently trades last at 1939.31.
The previous day high was 1985.25 while the previous day low was 1935.48. The daily 38.2% Fib levels comes at 1954.49, expected to provide resistance. Similarly, the daily 61.8% fib level is at 1966.24, expected to provide resistance.
Gold price (XAU/USD) has reverted to the $1,940.00 support after failing to extend its recovery above $1,946.00 in the Asian session. The precious metal is expected to remain sideways as investors are likely to execute meaningful positions after the announcement of the interest rate decision by the Federal Reserve (Fed).
It is worth noting that the Gold price is struggling to maintain its feet despite a subdued performance by the US Dollar Index (DXY). The recent rally in the Gold price was driven was weakness in the USD Index and stalwart fears of a banking sector meltdown in the United States after the collapse of three mid-size banks last week.
The commentary from United States Treasury Secretary Janet Yellen that Fed’s new Bank Term Funding facility and discount window lending are working to provide liquidity to the banking system has trimmed fears of further turmoil in the banking system. Also, the statement infused fresh blood into the share price of First Republic Bank on Tuesday. Earlier, the safe-haven appeal for Gold got firmer as investors shifted their money to bullions to safeguard themselves from sheer volatility.
The US Dollar Index (DXY) is continuously hovering around 103.20 as investors are cheering accelerating odds for a 25 basis point (bp) interest rate hike by the Fed. As per the CME Fedwatch tool, 85% chances are in favor of a 25bp rate hike, which would push rates to 4.75-5.00%.
Gold price delivered a perpendicular decline after a breakdown of the Head and Shoulder chart pattern on an hourly scale. A breakdown of the aforementioned chart pattern indicates a bearish reversal after a consolidation move. The Gold price has dropped to near the demand zone placed in a range of $1,933.90-1,938.40.
The 20-period Exponential Moving Average (EMA) at around $1,950.00 would continue to act as a barricade for Gold bulls.
Meanwhile, the Relative Strength Index (RSI) (14) is oscillating in the bearish range of 20.00-40.00, which indicates the downside momentum is still active.
Technical Levels: Supports and Resistances
XAUUSD currently trading at 1940.53 at the time of writing. Pair opened at 1940.24 and is trading with a change of 0.01 % .
| Overview | Overview.1 | |
|---|---|---|
| 0 | Today last price | 1940.53 |
| 1 | Today Daily Change | 0.29 |
| 2 | Today Daily Change % | 0.01 |
| 3 | Today daily open | 1940.24 |
The pair remains strongly bullish on the daily timeframe. It trades above its 20 SMA @ 1868.58, 50 SMA 1883.03, 100 SMA @ 1830.53 and 200 SMA @ 1778.41.
| Trends | Trends.1 | |
|---|---|---|
| 0 | Daily SMA20 | 1868.58 |
| 1 | Daily SMA50 | 1883.03 |
| 2 | Daily SMA100 | 1830.53 |
| 3 | Daily SMA200 | 1778.41 |
The previous day high was 1985.25 while the previous day low was 1935.48. The daily 38.2% Fib levels comes at 1954.49, expected to provide resistance. Similarly, the daily 61.8% fib level is at 1966.24, expected to provide resistance.
Note the levels of interest below:
- Pivot support is noted at 1922.06, 1903.89, 1872.29
- Pivot resistance is noted at 1971.83, 2003.43, 2021.6
| Levels | Levels.1 |
|---|---|
| Previous Daily High | 1985.25 |
| Previous Daily Low | 1935.48 |
| Previous Weekly High | 1989.51 |
| Previous Weekly Low | 1867.66 |
| Previous Monthly High | 1959.80 |
| Previous Monthly Low | 1804.76 |
| Daily Fibonacci 38.2% | 1954.49 |
| Daily Fibonacci 61.8% | 1966.24 |
| Daily Pivot Point S1 | 1922.06 |
| Daily Pivot Point S2 | 1903.89 |
| Daily Pivot Point S3 | 1872.29 |
| Daily Pivot Point R1 | 1971.83 |
| Daily Pivot Point R2 | 2003.43 |
| Daily Pivot Point R3 | 2021.60 |
[/s2If]
Join Our Telegram Group
")


