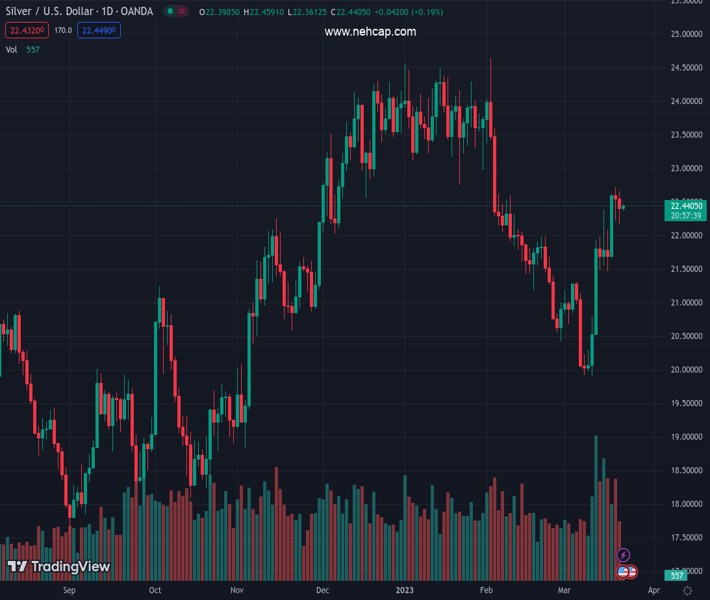
#XAGUSD @ 22.448 Silver price is auctioning in a 50-pip range for the past two sessions ahead of the interest rate decision by the Fed. (Pivot Orderbook analysis)
…
This is a premium post.
[s2If !current_user_can(access_s2member_level4)]Please register for PREMIUM VERSION HERE to read full post below containing analysis. In case of any error or you think you are not able to read the full post below, please email us at support#nehcap.com [lwa][/s2If] [s2If current_user_can(access_s2member_level4)]
- Silver price is auctioning in a 50-pip range for the past two sessions ahead of the interest rate decision by the Fed.
- The Fed will face a difficult balancing act between banking sector turmoil and persistent inflation.
- Two-day winning spell by S&P500 indicate that investors’ risk appetite is solid.
The pair currently trades last at 22.448.
The previous day high was 22.72 while the previous day low was 22.22. The daily 38.2% Fib levels comes at 22.41, expected to provide support. Similarly, the daily 61.8% fib level is at 22.53, expected to provide resistance.
Silver price (XAG/USD) has rebounded firmly from $22.20 in the early Asian session. The white metal has been consolidating in a range of $22.20-22.70 for the past three trading sessions. The asset is expected to remain inside the woods ahead as pre-Federal Reserve (Fed) anxiety could come into play despite the odds favoring a consecutive 25 basis point (bp) rate hike to 4.75-5.00%.
Fed chair Jerome Powell couldn’t take risk of a revival in the inflationary pressures, therefore, the central bank would continue its policy-tightening spell to keep weighing on the Consumer Price Index (CPI). Analysts at Swedbank are sticking with their call that the Fed will hike rates by 25 bps both this week and at its May meeting. They further added, the Fed will, however, face a difficult balancing act between on the one hand being ready to support the financial sector, while also signaling further tightening is on the cards to tame inflation.
Commenting on the risk impulse, a two-day winning spell by S&P500 indicates that investors’ risk appetite is solid now, however, caution prevails as fears of a banking sector meltdown are not faded yet. The US Dollar Index (DXY) is juggling near 103.20 after failing to extend its recovery above 103.50. A sheer volatility would be visible in the USD Index if Fed decides to take an unchanged stance on interest rates as it is more versed in the situation of the banking sector.
Silver price is demonstrating a sideways auction in the 50-pip range for the past two sessions on an hourly scale. The white metal is showing signs of weakness in the upside momentum, which indicates that a corrective move is on cards. The asset is putting efforts into keeping itself above the 20-period Exponential Moving Average (EMA) at $22.40.
Meanwhile, the Relative Strength Index (RSI) (14) is oscillating in the 40.00-60.00 range, which indicates that investors are awaiting a new trigger for further action.
Technical Levels: Supports and Resistances
XAGUSD currently trading at 22.44 at the time of writing. Pair opened at 22.55 and is trading with a change of -0.49 % .
| Overview | Overview.1 | |
|---|---|---|
| 0 | Today last price | 22.44 |
| 1 | Today Daily Change | -0.11 |
| 2 | Today Daily Change % | -0.49 |
| 3 | Today daily open | 22.55 |
The pair remains strongly bullish on the daily timeframe. It trades above its 20 SMA @ 21.2, 50 SMA 22.31, 100 SMA @ 22.36 and 200 SMA @ 20.95.
| Trends | Trends.1 | |
|---|---|---|
| 0 | Daily SMA20 | 21.20 |
| 1 | Daily SMA50 | 22.31 |
| 2 | Daily SMA100 | 22.36 |
| 3 | Daily SMA200 | 20.95 |
The previous day high was 22.72 while the previous day low was 22.22. The daily 38.2% Fib levels comes at 22.41, expected to provide support. Similarly, the daily 61.8% fib level is at 22.53, expected to provide resistance.
Note the levels of interest below:
- Pivot support is noted at 22.28, 22.0, 21.78
- Pivot resistance is noted at 22.77, 22.99, 23.27
| Levels | Levels.1 |
|---|---|
| Previous Daily High | 22.72 |
| Previous Daily Low | 22.22 |
| Previous Weekly High | 22.61 |
| Previous Weekly Low | 20.54 |
| Previous Monthly High | 24.64 |
| Previous Monthly Low | 20.42 |
| Daily Fibonacci 38.2% | 22.41 |
| Daily Fibonacci 61.8% | 22.53 |
| Daily Pivot Point S1 | 22.28 |
| Daily Pivot Point S2 | 22.00 |
| Daily Pivot Point S3 | 21.78 |
| Daily Pivot Point R1 | 22.77 |
| Daily Pivot Point R2 | 22.99 |
| Daily Pivot Point R3 | 23.27 |
[/s2If]
Join Our Telegram Group
")


