WTI struggles to keep bears on the table while snapping two-day winning streak. (Pivot Orderbook analysis)
…
This is a premium post.
[s2If !current_user_can(access_s2member_level4)]Please register for PREMIUM VERSION HERE to read full post below containing analysis. In case of any error or you think you are not able to read the full post below, please email us at support#nehcap.com [lwa][/s2If] [s2If current_user_can(access_s2member_level4)]
- WTI struggles to keep bears on the table while snapping two-day winning streak.
- API Weekly Crude Oil Stock marked unexpected build of inventory during the week ended on March 17.
- US Oil refiners’ optimism, softer US Dollar ahead of the Fed keeps buyers hopeful.
- Federal Reserve, EIA stockpiles eyed for clear directions.
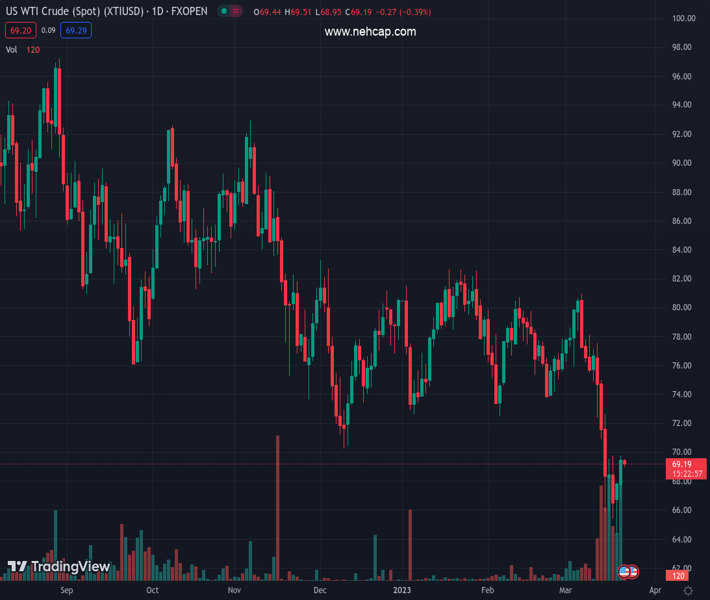
The pair currently trades last at 69.32.
The previous day high was 69.78 while the previous day low was 66.94. The daily 38.2% Fib levels comes at 68.7, expected to provide support. Similarly, the daily 61.8% fib level is at 68.03, expected to provide support.
WTI crude oil picks up bids to pare intraday losses, the first in three, amid early Wednesday’s sluggish trading. That said, the black gold dropped during the initial hours after downbeat inventory data joined the US Dollar’s corrective bounce and price-negative industry news. However, the greenback’s failure to stay firmer and cautious optimism in the market seem to help the energy benchmark as it prints mild losses near $69.30 at the latest.
On Tuesday, the private Oil inventory data provider American Petroleum Institute (API) showed the Weekly Oil Stock increased by 3.262M for the week ended on March 17 versus 1.155M prior.
Apart from the higher inventory levels, the US Dollar’s corrective bounce, backed by an initial rebound in the US Treasury bond yields, also favored the WTI crude oil sellers after a two-day uptrend.
Furthermore, a lack of impressive news from China President Xi Jinping’s meeting with Russian counterpart Vladimir Putin, despite criticizing the Western helps to Ukraine, seems to exert downside pressure on the Oil price.
Additionally, news from Reuters suggesting optimism in the US oil refining industry also tease the WTI bears. “The US oil refining industry expects to maintain a competitive advantage exporting fuel to Latin America, even though Brazil has started to import more Russian diesel, according to an official at a top US refining lobby,” said Reuters.
Above all, the market’s indecision ahead of the Federal Open Market Committee (FOMC) monetary policy meeting challenges WTI traders. Also important to watch is the weekly Crude Oil inventory data from the US Energy Information Administration (EIA), up for publishing on Wednesday and expected -1.448M versus 1.55M prior.
December 2022 low near $70.30 precedes a two-week-old descending resistance line, around $71.40, to restrict Crude Oil upside.
Technical Levels: Supports and Resistances
XTIUSD currently trading at 69.32 at the time of writing. Pair opened at 69.53 and is trading with a change of -0.30% % .
| Overview | Overview.1 | |
|---|---|---|
| 0 | Today last price | 69.32 |
| 1 | Today Daily Change | -0.21 |
| 2 | Today Daily Change % | -0.30% |
| 3 | Today daily open | 69.53 |
The pair remains strongly bearish on the daily time frame. It trades below the 20 SMA @ 74.44, 50 SMA 76.99, 100 SMA @ 78.23 and 200 SMA @ 85.09.
| Trends | Trends.1 | |
|---|---|---|
| 0 | Daily SMA20 | 74.44 |
| 1 | Daily SMA50 | 76.99 |
| 2 | Daily SMA100 | 78.23 |
| 3 | Daily SMA200 | 85.09 |
The previous day high was 69.78 while the previous day low was 66.94. The daily 38.2% Fib levels comes at 68.7, expected to provide support. Similarly, the daily 61.8% fib level is at 68.03, expected to provide support.
Note the levels of interest below:
- Pivot support is noted at 67.72, 65.91, 64.88
- Pivot resistance is noted at 70.56, 71.59, 73.4
| Levels | Levels.1 |
|---|---|
| Previous Daily High | 69.78 |
| Previous Daily Low | 66.94 |
| Previous Weekly High | 77.55 |
| Previous Weekly Low | 65.44 |
| Previous Monthly High | 80.75 |
| Previous Monthly Low | 72.50 |
| Daily Fibonacci 38.2% | 68.70 |
| Daily Fibonacci 61.8% | 68.03 |
| Daily Pivot Point S1 | 67.72 |
| Daily Pivot Point S2 | 65.91 |
| Daily Pivot Point S3 | 64.88 |
| Daily Pivot Point R1 | 70.56 |
| Daily Pivot Point R2 | 71.59 |
| Daily Pivot Point R3 | 73.40 |
[/s2If]
Join Our Telegram Group
")


