#USDCAD @ 1.37034 lacks any firm intraday direction and oscillates in a narrow trading band on Wednesday. (Pivot Orderbook analysis)
…
This is a premium post.
[s2If !current_user_can(access_s2member_level4)]Please register for PREMIUM VERSION HERE to read full post below containing analysis. In case of any error or you think you are not able to read the full post below, please email us at support#nehcap.com [lwa][/s2If] [s2If current_user_can(access_s2member_level4)]
- USD/CAD lacks any firm intraday direction and oscillates in a narrow trading band on Wednesday.
- The prevalent USD selling bias acts as a headwind in the wake of the recent recovery in Oil prices.
- Tuesday’s softer Canadian CPI print caps gains for the Loonie and lends support ahead of the Fed.
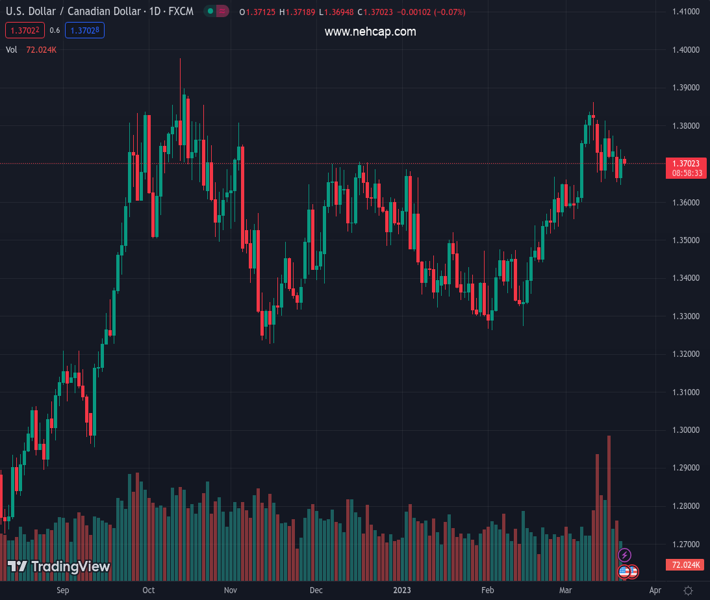
The pair currently trades last at 1.37034.
The previous day high was 1.3738 while the previous day low was 1.3644. The daily 38.2% Fib levels comes at 1.3702, expected to provide support. Similarly, the daily 61.8% fib level is at 1.368, expected to provide support.
The USD/CAD pair struggles to capitalize on the previous day’s goodish rebound from a two-week low and edges lower on Tuesday amid the prevalent US Dollar (USD) selling bias. The pair remains depressed around the 1.3700 mark through the mid-European session, though the downside seems cushioned as traders keenly await the highly-anticipated FOMC monetary policy decision.
The US central bank is scheduled to announce the outcome of a two-day meeting later during the US session and is expected to deliver a smaller 25 bps rate hike. Moreover, the collapse of two mid-size US banks – Silicon Valley Bank and Signature Bank – has been fueling speculations that the US central bank might even cut rates during the second half of the year. Hence, investors will closely scrutinize the accompanying policy statement, the updated economic projections and Fed Chair Jerome Powell’s comments at the post-meeting press conference for clues about the future rate-hike path. This will play a key role in influencing the near-term US Dollar price dynamics and determine the next leg of a directional move for the USD/CAD pair.
Heading into the key central bank event risks, expectations that the Fed will adopt a less hawkish stance, along with easing fears of a full-blown banking crisis, drags the safe-haven USD to a fresh multi-week low. This, along with this week’s solid recovery in Crude Oil prices from a 15-month low, underpins the commodity-linked Loonie and acts as a headwind for the USD/CAD pair. That said, the softer-than-expected Canadian consumer inflation released on Tuesday backed the case for the Bank of Canada (BoC) to refrain from raising interest rates any further. This, in turn, caps the upside for the Canadian Dollar and is seen lending some support to the pair, warranting some caution before positioning for a meaningful slide.
Technical Levels: Supports and Resistances
USDCAD currently trading at 1.371 at the time of writing. Pair opened at 1.3712 and is trading with a change of -0.01 % .
| Overview | Overview.1 | |
|---|---|---|
| 0 | Today last price | 1.3710 |
| 1 | Today Daily Change | -0.0002 |
| 2 | Today Daily Change % | -0.0100 |
| 3 | Today daily open | 1.3712 |
The pair remains strongly bullish on the daily timeframe. It trades above its 20 SMA @ 1.3677, 50 SMA 1.3509, 100 SMA @ 1.3511 and 200 SMA @ 1.3348.
| Trends | Trends.1 | |
|---|---|---|
| 0 | Daily SMA20 | 1.3677 |
| 1 | Daily SMA50 | 1.3509 |
| 2 | Daily SMA100 | 1.3511 |
| 3 | Daily SMA200 | 1.3348 |
The previous day high was 1.3738 while the previous day low was 1.3644. The daily 38.2% Fib levels comes at 1.3702, expected to provide support. Similarly, the daily 61.8% fib level is at 1.368, expected to provide support.
Note the levels of interest below:
- Pivot support is noted at 1.3659, 1.3605, 1.3566
- Pivot resistance is noted at 1.3752, 1.3791, 1.3845
| Levels | Levels.1 |
|---|---|
| Previous Daily High | 1.3738 |
| Previous Daily Low | 1.3644 |
| Previous Weekly High | 1.3828 |
| Previous Weekly Low | 1.3652 |
| Previous Monthly High | 1.3666 |
| Previous Monthly Low | 1.3262 |
| Daily Fibonacci 38.2% | 1.3702 |
| Daily Fibonacci 61.8% | 1.3680 |
| Daily Pivot Point S1 | 1.3659 |
| Daily Pivot Point S2 | 1.3605 |
| Daily Pivot Point S3 | 1.3566 |
| Daily Pivot Point R1 | 1.3752 |
| Daily Pivot Point R2 | 1.3791 |
| Daily Pivot Point R3 | 1.3845 |
[/s2If]
Join Our Telegram Group
")


