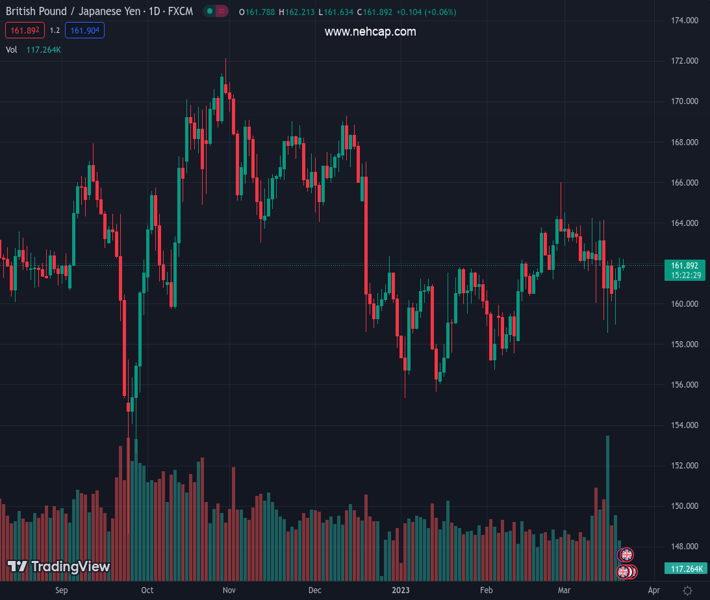
#GBPJPY @ 161.891 is aiming to deliver a breakout of the Inverted H&S as BoE would continue its policy-tightening spell. (Pivot Orderbook analysis)
…
This is a premium post.
[s2If !current_user_can(access_s2member_level4)]Please register for PREMIUM VERSION HERE to read full post below containing analysis. In case of any error or you think you are not able to read the full post below, please email us at support#nehcap.com [lwa][/s2If] [s2If current_user_can(access_s2member_level4)]
- GBP/JPY is aiming to deliver a breakout of the Inverted H&S as BoE would continue its policy-tightening spell.
- The 20-period EMA at 161.77 is providing cushion to the Pound Sterling bulls.
- A break into the 60.00-80.00 range by the RSI (14) would activate the bullish momentum.
The pair currently trades last at 161.891.
The previous day high was 162.26 while the previous day low was 160.76. The daily 38.2% Fib levels comes at 161.69, expected to provide support. Similarly, the daily 61.8% fib level is at 161.34, expected to provide support.
The GBP/JPY pair has gradually inched back to near the 162.00 resistance in the early European session. The cross is likely to possess an upside bias ahead of the monetary policy announcement by the Bank of England (BoE). Thursday’s BoE policy is likely to be concluded with a 25 basis point (bp) rate hike despite fears of a banking fiasco and a dismal economic outlook.
But before that, the United Kingdom inflation data will remain in focus. The street is anticipating a decline in the annual headline Consumer Price Index (CPI) to 9.8% from the former release of 10.1%. While the core CPI that excludes oil and food prices would remain steady at 5.8%. A higher inflation rate might bolster the odds of a 25 bps rate hike announcement from BoE Governor Andrew Bailey.
Meanwhile, the Japanese economy is focusing on providing relief to households as they are struggling to offset inflated prices of goods and services.
GBP/JPY is aiming to deliver a breakout of the Inverted Head and Shoulder chart pattern formed on an hourly scale. The neckline of the Inverted H&S chart pattern is plotted from March 17 high at 162.19. A breakout of the aforementioned chart pattern will result in wider ticks and heavy volume towards the north.
The 20-period Exponential Moving Average (EMA) at 161.77 is providing cushion to the Pound Sterling bulls.
Meanwhile, the Relative Strength Index (RSI) (14) is struggling to shift into the bullish range of 60.00-80.00. An occurrence of the same would activate the bullish momentum.
Going forward, a decisive break above March 17 high at 162.19 would drive the cross toward March 08 high around 163.00 followed by the horizontal resistance plotted from March 10 high at 164.24.
On the flip side, a break below March 21 low at 160.76 would drag the asset toward March 17 low at 160.16. A breach of the latter would drag the cross toward March 20 low around 159.00.
Technical Levels: Supports and Resistances
GBPJPY currently trading at 161.88 at the time of writing. Pair opened at 161.88 and is trading with a change of 0.0 % .
| Overview | Overview.1 | |
|---|---|---|
| 0 | Today last price | 161.88 |
| 1 | Today Daily Change | 0.00 |
| 2 | Today Daily Change % | 0.00 |
| 3 | Today daily open | 161.88 |
The pair is trading below its 20 Daily moving average @ 162.53, above its 50 Daily moving average @ 160.92 , below its 100 Daily moving average @ 162.72 and below its 200 Daily moving average @ 163.3
| Trends | Trends.1 | |
|---|---|---|
| 0 | Daily SMA20 | 162.53 |
| 1 | Daily SMA50 | 160.92 |
| 2 | Daily SMA100 | 162.72 |
| 3 | Daily SMA200 | 163.30 |
The previous day high was 162.26 while the previous day low was 160.76. The daily 38.2% Fib levels comes at 161.69, expected to provide support. Similarly, the daily 61.8% fib level is at 161.34, expected to provide support.
Note the levels of interest below:
- Pivot support is noted at 161.01, 160.14, 159.51
- Pivot resistance is noted at 162.51, 163.14, 164.01
| Levels | Levels.1 |
|---|---|
| Previous Daily High | 162.26 |
| Previous Daily Low | 160.76 |
| Previous Weekly High | 164.14 |
| Previous Weekly Low | 158.57 |
| Previous Monthly High | 166.01 |
| Previous Monthly Low | 156.73 |
| Daily Fibonacci 38.2% | 161.69 |
| Daily Fibonacci 61.8% | 161.34 |
| Daily Pivot Point S1 | 161.01 |
| Daily Pivot Point S2 | 160.14 |
| Daily Pivot Point S3 | 159.51 |
| Daily Pivot Point R1 | 162.51 |
| Daily Pivot Point R2 | 163.14 |
| Daily Pivot Point R3 | 164.01 |
[/s2If]
Join Our Telegram Group
")


