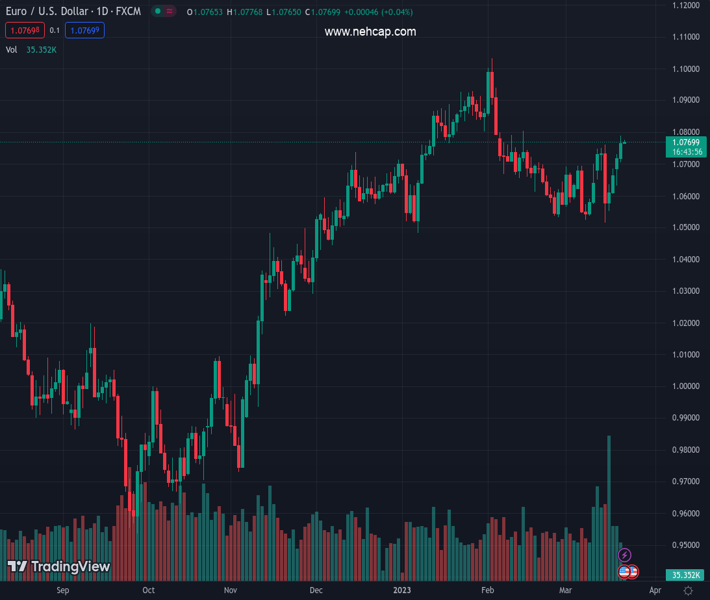
#EURUSD @ 1.07688 struggles for clear directions around five-week high inside short-term ascending triangle., @nehcap view: Limited upside expected (Pivot Orderbook analysis)
…
This is a premium post.
[s2If !current_user_can(access_s2member_level4)]Please register for PREMIUM VERSION HERE to read full post below containing analysis. In case of any error or you think you are not able to read the full post below, please email us at support#nehcap.com [lwa][/s2If] [s2If current_user_can(access_s2member_level4)]
- EUR/USD struggles for clear directions around five-week high inside short-term ascending triangle.
- Sustained trading above 100-DMA, upbeat oscillators favor four-day uptrend but pre-Fed anxiety challenges traders.
- Mid-February high adds strength to 1.0800 upside hurdle; Euro sellers can return on 1.0700 break.
The pair currently trades last at 1.07688.
The previous day high was 1.0789 while the previous day low was 1.0704. The daily 38.2% Fib levels comes at 1.0756, expected to provide support. Similarly, the daily 61.8% fib level is at 1.0736, expected to provide support.
EUR/USD treads water around 1.0770-80 as pre-Fed anxiety intensifies during early Wednesday. Adding strength to the cautious mood could be a speech from European Central Bank (ECB) President Christine Lagarde, as well as an ascending triangle formation established since March 01.
Also read: EUR/USD aptly portrays pre-Fed anxiety below 1.0800, ECB’s Lagarde eyed
It should be noted, however, that the Euro pair’s successful rebound from the 100-DMA joins the bullish MACD signals and upbeat RSI (14) line, not overbought, to keep the buyers hopeful.
That said, the area between 1.0800 and 1.0700 currently restricts the EUR/USD pair’s moves. Adding strength to the 1.0800 hurdle is the late January low and February 14 swing high. Hence, the EUR/USD pair buyers have a tough run to the north.
On the contrary, a downside break of the 1.0700 support can quickly drag the quote toward the 100-DMA support level surrounding 1.0595.
Though, the 61.8% Fibonacci retracement level of the EUR/USD pair’s run-up between late last November and early February, around 1.0530, can test the bears afterward.
Meanwhile, a successful break of the 1.0800 resistance confluence won’t hesitate to aim for January’s high of near 1.0930 before targeting the Year-To-Date (YTD) high marked in February around 1.1035.
Trend: Limited upside expected
Technical Levels: Supports and Resistances
EURUSD currently trading at 1.077 at the time of writing. Pair opened at 1.0768 and is trading with a change of 0.02% % .
| Overview | Overview.1 | |
|---|---|---|
| 0 | Today last price | 1.077 |
| 1 | Today Daily Change | 0.0002 |
| 2 | Today Daily Change % | 0.02% |
| 3 | Today daily open | 1.0768 |
The pair remains strongly bullish on the daily timeframe. It trades above its 20 SMA @ 1.0632, 50 SMA 1.0729, 100 SMA @ 1.0586 and 200 SMA @ 1.0329.
| Trends | Trends.1 | |
|---|---|---|
| 0 | Daily SMA20 | 1.0632 |
| 1 | Daily SMA50 | 1.0729 |
| 2 | Daily SMA100 | 1.0586 |
| 3 | Daily SMA200 | 1.0329 |
The previous day high was 1.0789 while the previous day low was 1.0704. The daily 38.2% Fib levels comes at 1.0756, expected to provide support. Similarly, the daily 61.8% fib level is at 1.0736, expected to provide support.
Note the levels of interest below:
- Pivot support is noted at 1.0718, 1.0669, 1.0634
- Pivot resistance is noted at 1.0803, 1.0838, 1.0887
| Levels | Levels.1 |
|---|---|
| Previous Daily High | 1.0789 |
| Previous Daily Low | 1.0704 |
| Previous Weekly High | 1.0760 |
| Previous Weekly Low | 1.0516 |
| Previous Monthly High | 1.1033 |
| Previous Monthly Low | 1.0533 |
| Daily Fibonacci 38.2% | 1.0756 |
| Daily Fibonacci 61.8% | 1.0736 |
| Daily Pivot Point S1 | 1.0718 |
| Daily Pivot Point S2 | 1.0669 |
| Daily Pivot Point S3 | 1.0634 |
| Daily Pivot Point R1 | 1.0803 |
| Daily Pivot Point R2 | 1.0838 |
| Daily Pivot Point R3 | 1.0887 |
[/s2If]
Join Our Telegram Group
")


