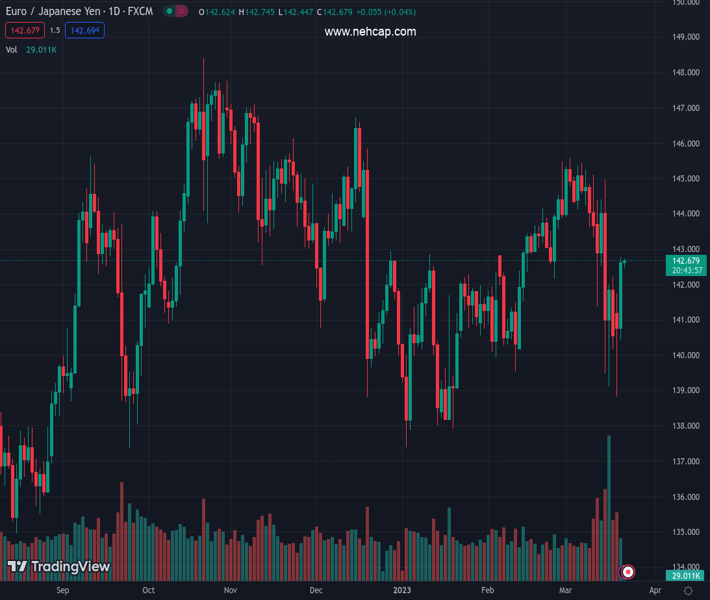
#EURJPY @ 142.742 is gathering strength for a fresh upside as Eurozone inflation is likely to remain sticky. (Pivot Orderbook analysis)
…
This is a premium post.
[s2If !current_user_can(access_s2member_level4)]Please register for PREMIUM VERSION HERE to read full post below containing analysis. In case of any error or you think you are not able to read the full post below, please email us at support#nehcap.com [lwa][/s2If] [s2If current_user_can(access_s2member_level4)]
- EUR/JPY is gathering strength for a fresh upside as Eurozone inflation is likely to remain sticky.
- Eurozone-ZEW Survey reported a sheer decline to 10.0 after an appreciating spell of five months.
- The asset has shown a reversal after sensing buying interest around the horizontal resistance-turned-support plotted at 142.22.
The pair currently trades last at 142.742.
The previous day high was 142.79 while the previous day low was 140.42. The daily 38.2% Fib levels comes at 141.89, expected to provide support. Similarly, the daily 61.8% fib level is at 141.33, expected to provide support.
The EUR/JPY pair is displaying topsy-turvy moves in a narrow range around 142.55 in the early Tokyo session. The cross is likely gathering strength for further upside as the European Central Bank (ECB) would be continued with bigger rates spell to sharpen its monetary tools in the battle against Eurozone’s sticky inflation.
ECB President Christine Laragde cited that inflation in Eurozone will be higher for a longer period. The statement is backed by higher wage prices and prolonged supply-chain disruptions amid more than a year longer Russia-Ukraine war.
Meanwhile, the banking sector crisis amid the demise of Credit Suisse has spooked the sentiment of institutional investors. Eurozone-ZEW Survey, released on Tuesday, reported a sheer decline to 10.0 after an appreciating spell of five months.
On the Tokyo front, Japanese Chief Cabinet Secretary Hirokazu Matsuno has promised to allocate more than 2 trillion yen from reserves to safeguard households from rising prices, as reported by Reuters. The relief package move would stimulate the overall liquidity in the economy and might support in keeping inflation steady near the desired rate.
EUR/JPY has shown a reversal after sensing buying interest around the horizontal resistance-turned-support plotted from March 17 high at 142.22.
Upward-sloping 21-period Exponential Moving Average (EMA) at 142.22 indicates more upside ahead.
Adding to that, the Relative Strength Index (RSI) (14) is oscillating in the bullish range of 60.00-80.00, which indicates that the upside momentum is already active.
Should the asset breaks above March 21 high at 142.79, Euro bulls would drive the cross toward March 09 low around 144.00 followed by March 15 high at 145.00.
On the flip side, a downside break below March 20 high at 141.76 would drag the cross toward March 13 low at 139.48. A slippage below the same would expose the asset to January 19 low around 138.00
Technical Levels: Supports and Resistances
EURJPY currently trading at 142.63 at the time of writing. Pair opened at 142.66 and is trading with a change of -0.02 % .
| Overview | Overview.1 | |
|---|---|---|
| 0 | Today last price | 142.63 |
| 1 | Today Daily Change | -0.03 |
| 2 | Today Daily Change % | -0.02 |
| 3 | Today daily open | 142.66 |
The pair is trading below its 20 Daily moving average @ 143.46, above its 50 Daily moving average @ 142.17 , below its 100 Daily moving average @ 142.76 and above its 200 Daily moving average @ 141.82
| Trends | Trends.1 | |
|---|---|---|
| 0 | Daily SMA20 | 143.46 |
| 1 | Daily SMA50 | 142.17 |
| 2 | Daily SMA100 | 142.76 |
| 3 | Daily SMA200 | 141.82 |
The previous day high was 142.79 while the previous day low was 140.42. The daily 38.2% Fib levels comes at 141.89, expected to provide support. Similarly, the daily 61.8% fib level is at 141.33, expected to provide support.
Note the levels of interest below:
- Pivot support is noted at 141.13, 139.59, 138.75
- Pivot resistance is noted at 143.5, 144.33, 145.87
| Levels | Levels.1 |
|---|---|
| Previous Daily High | 142.79 |
| Previous Daily Low | 140.42 |
| Previous Weekly High | 144.96 |
| Previous Weekly Low | 139.13 |
| Previous Monthly High | 145.47 |
| Previous Monthly Low | 139.55 |
| Daily Fibonacci 38.2% | 141.89 |
| Daily Fibonacci 61.8% | 141.33 |
| Daily Pivot Point S1 | 141.13 |
| Daily Pivot Point S2 | 139.59 |
| Daily Pivot Point S3 | 138.75 |
| Daily Pivot Point R1 | 143.50 |
| Daily Pivot Point R2 | 144.33 |
| Daily Pivot Point R3 | 145.87 |
[/s2If]
Join Our Telegram Group
")


