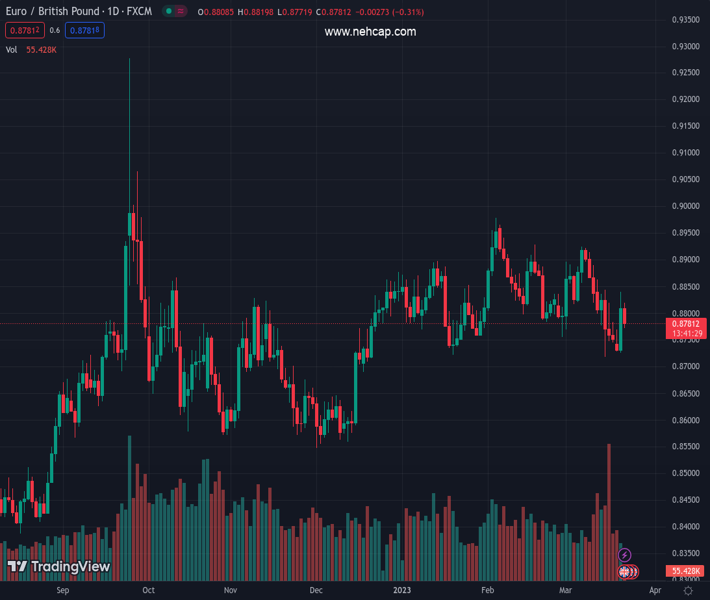
#EURGBP @ 0.87794 takes offers to refresh intraday low, pares the biggest daily gains in three weeks. (Pivot Orderbook analysis)
…
This is a premium post.
[s2If !current_user_can(access_s2member_level4)]Please register for PREMIUM VERSION HERE to read full post below containing analysis. In case of any error or you think you are not able to read the full post below, please email us at support#nehcap.com [lwa][/s2If] [s2If current_user_can(access_s2member_level4)]
- EUR/GBP takes offers to refresh intraday low, pares the biggest daily gains in three weeks.
- UK CPI rose to 10.4% in February versus 0.6% expected and -0.6% prior.
- Former UK PM Johnson joins ERG, DUP to renew Brexit woes.
- Banking crisis may probe ECB’s Lagarde to soften hawkish bias.
The pair currently trades last at 0.87794.
The previous day high was 0.884 while the previous day low was 0.8731. The daily 38.2% Fib levels comes at 0.8798, expected to provide resistance. Similarly, the daily 61.8% fib level is at 0.8772, expected to provide support.
EUR/GBP renews intraday low to 0.8781 as upbeat UK inflation data bolsters hawkish hopes from the Bank of England (BoE) on early Wednesday. That said, the cross-currency pair’s rallied the most three weeks the previous day as pessimism surrounding the Brexit deal joined hawkish comments from the European Central Bank (ECB) officials.
UK’s headline inflation data, namely the Consumer Price Index (CPI) rose to 10.4% YoY in February versus 9.8% expected and 10.1% previous readings while the Core CPI rose to 6.2% compared to 5.8% market forecasts and previous readings. Given the improvement in the British inflation figures, the Bank of England (BoE) may be able to perform well in its likely last hawkish dance on Thursday, which in turn helps the EUR/GBP bears.
Also read: Breaking: UK annualized CPI inflation jumps to 10.4% in February vs. 9.8% expected
It’s worth noting, however, that the pessimism surrounding UK Prime Minister (PM) Rishi Sunak’s Brexit deal among some fellow Conservatives and the European Research Group (ERG), as well as the Democratic Unionist party (DUP), put a floor under the EUR/GBP prices. As per the latest headlines from The Telegraph, “Boris Johnson will vote against Rishi Sunak’s Brexit deal on Wednesday in a major boost for Tory rebels who warn it is not the right solution for Northern Ireland.”
Elsewhere, ECB policymaker Martins Kazaks said on Tuesday, “Uncertainty in the financial markets is high, but European banks are well capitalized.” The policymaker also added that there is no reason to compare the situation with 2008. Additionally, the ECB board member and Spanish central bank head Pablo Hernandez de Cos said on Tuesday, “market expectations of a 3.25% rate peak cannot be validated.” Recently, ECB policymaker and Bundesbank Chief Joachim Nagel said, “There’s still some way to go, but we are approaching restrictive territory.”
Having witnessed the initial reaction to the UK’s inflation data, EUR/GBP pair traders should pay attention to the Brexit developments in the House of Commons, as well as a speech from ECB President Christine Lagarde for fresh impulse. Above all, Thursday’s Bank of England (BoE) announcements are crucial for the cross-currency pair traders to watch as the British central bank appears running out of steam to back the hawkish moves.
Also read: BoE Interest Rate Decision Preview: Preparing the ground for a rate hike pause in May
Failure to cross the convergence of 21-DMA and 50-DMA, around 0.8820 by the press time, keeps EUR/GBP bears hopeful.
Technical Levels: Supports and Resistances
EURGBP currently trading at 0.8804 at the time of writing. Pair opened at 0.8813 and is trading with a change of -0.10% % .
| Overview | Overview.1 | |
|---|---|---|
| 0 | Today last price | 0.8804 |
| 1 | Today Daily Change | -0.0009 |
| 2 | Today Daily Change % | -0.10% |
| 3 | Today daily open | 0.8813 |
The pair is trading below its 20 Daily moving average @ 0.8826, below its 50 Daily moving average @ 0.8835 , above its 100 Daily moving average @ 0.8775 and above its 200 Daily moving average @ 0.8686
| Trends | Trends.1 | |
|---|---|---|
| 0 | Daily SMA20 | 0.8826 |
| 1 | Daily SMA50 | 0.8835 |
| 2 | Daily SMA100 | 0.8775 |
| 3 | Daily SMA200 | 0.8686 |
The previous day high was 0.884 while the previous day low was 0.8731. The daily 38.2% Fib levels comes at 0.8798, expected to provide resistance. Similarly, the daily 61.8% fib level is at 0.8772, expected to provide support.
Note the levels of interest below:
- Pivot support is noted at 0.8749, 0.8686, 0.864
- Pivot resistance is noted at 0.8858, 0.8904, 0.8967
| Levels | Levels.1 |
|---|---|
| Previous Daily High | 0.8840 |
| Previous Daily Low | 0.8731 |
| Previous Weekly High | 0.8864 |
| Previous Weekly Low | 0.8718 |
| Previous Monthly High | 0.8979 |
| Previous Monthly Low | 0.8755 |
| Daily Fibonacci 38.2% | 0.8798 |
| Daily Fibonacci 61.8% | 0.8772 |
| Daily Pivot Point S1 | 0.8749 |
| Daily Pivot Point S2 | 0.8686 |
| Daily Pivot Point S3 | 0.8640 |
| Daily Pivot Point R1 | 0.8858 |
| Daily Pivot Point R2 | 0.8904 |
| Daily Pivot Point R3 | 0.8967 |
[/s2If]
Join Our Telegram Group
")


