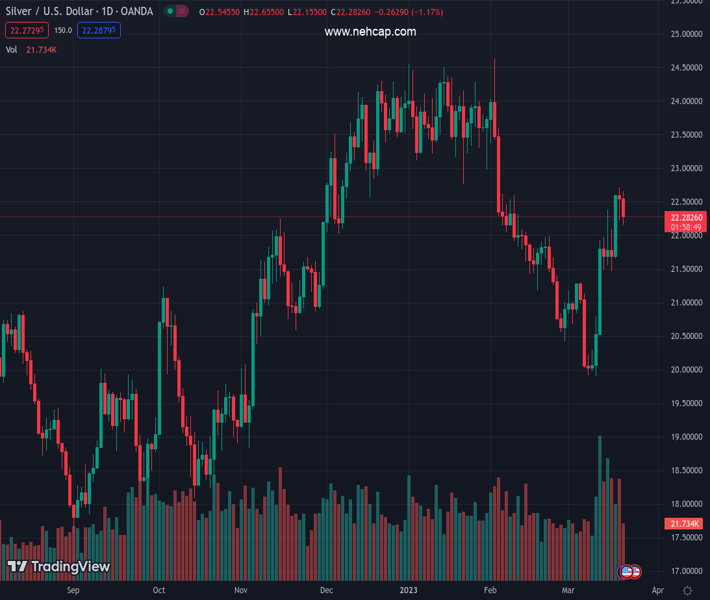
#XAGUSD @ 22.272 drops on risk-on mood and technical factors as a dragonfly doji emerges. (Pivot Orderbook analysis)
…
This is a premium post.
[s2If !current_user_can(access_s2member_level4)]Please register for PREMIUM VERSION HERE to read full post below containing analysis. In case of any error or you think you are not able to read the full post below, please email us at support#nehcap.com [lwa][/s2If] [s2If current_user_can(access_s2member_level4)]
- XAG/USD drops on risk-on mood and technical factors as a dragonfly doji emerges.
- If the XAG/USD drops below $22.00, sellers would face support barricades in the $21.80-90 area.
- XAG/USD Price Analysis: To consolidate around familiar levels ahead of the FOMC’s decision.
The pair currently trades last at 22.272.
The previous day high was 22.72 while the previous day low was 22.22. The daily 38.2% Fib levels comes at 22.41, expected to provide resistance. Similarly, the daily 61.8% fib level is at 22.53, expected to provide resistance.
Silver price reversed its bullish course, dropping around 1.20% late in the mid-North American session. After hitting a seven-week high of $22.71 on Monday, the XAG/USD has retraced some of those gains, trading nearby March’s 20 daily low of $22.22. At the time of writing, the XAG/USD is trading at $22.29, down 0.27 percent.
The week began with the white metal printing a new multi-week high before reversing and closing above $22.50. On its way north, the XAG/USD reclaimed the 200-day EMA, shifting the white metal bias to neutral upwards. Nevertheless, a dragonfly doji emerged at the daily, exacerbating Silver’s fall toward the $22.20 area.
If XAG/USD tumbles below $22.00, that would pave the way for a dip to the 50-day EMA at $21.91, immediately followed by the 100-day EMA At $21.89. Once cleared, the 200-day EMA at $21.81 would be next, ahead of falling to the 20-day EMA at $21.60.
Conversely, the XAG/USD first resistance would be the March 17 daily high at $22.59, followed by the March 20 high at $22.71. Upside risks remain above $23.00.
Technical Levels: Supports and Resistances
XAGUSD currently trading at 22.3 at the time of writing. Pair opened at 22.55 and is trading with a change of -1.11 % .
| Overview | Overview.1 | |
|---|---|---|
| 0 | Today last price | 22.30 |
| 1 | Today Daily Change | -0.25 |
| 2 | Today Daily Change % | -1.11 |
| 3 | Today daily open | 22.55 |
The pair is trading above its 20 Daily moving average @ 21.2, below its 50 Daily moving average @ 22.31 , below its 100 Daily moving average @ 22.36 and above its 200 Daily moving average @ 20.95
| Trends | Trends.1 | |
|---|---|---|
| 0 | Daily SMA20 | 21.20 |
| 1 | Daily SMA50 | 22.31 |
| 2 | Daily SMA100 | 22.36 |
| 3 | Daily SMA200 | 20.95 |
The previous day high was 22.72 while the previous day low was 22.22. The daily 38.2% Fib levels comes at 22.41, expected to provide resistance. Similarly, the daily 61.8% fib level is at 22.53, expected to provide resistance.
Note the levels of interest below:
- Pivot support is noted at 22.28, 22.0, 21.78
- Pivot resistance is noted at 22.77, 22.99, 23.27
| Levels | Levels.1 |
|---|---|
| Previous Daily High | 22.72 |
| Previous Daily Low | 22.22 |
| Previous Weekly High | 22.61 |
| Previous Weekly Low | 20.54 |
| Previous Monthly High | 24.64 |
| Previous Monthly Low | 20.42 |
| Daily Fibonacci 38.2% | 22.41 |
| Daily Fibonacci 61.8% | 22.53 |
| Daily Pivot Point S1 | 22.28 |
| Daily Pivot Point S2 | 22.00 |
| Daily Pivot Point S3 | 21.78 |
| Daily Pivot Point R1 | 22.77 |
| Daily Pivot Point R2 | 22.99 |
| Daily Pivot Point R3 | 23.27 |
[/s2If]
Join Our Telegram Group
")


